Aerodynamic Parameters and the Airflow Regression Slope (ARS) in Patients with Vocal Polyps before and after Laryngomicrosurgery according to Perceptual Judgment
Article information
Abstract
Purpose
The aims of this study were to explore changes in aerodynamic measures after vocal polyp removal and to determine whether the airflow regression slope (ARS) was a useful aerodynamic measurement.
Methods
Thirty-nine patients (14 males and 25 females) between the ages of 19 and 76 years (median=47.62 years, SD=12.20 years) were evaluated; their details were logged in the database of Chungnam National University Hospital from March 2015 to May 2016. All patients were diagnosed with vocal polyps and underwent laryngomicrosurgery (LMS) with voice evaluation 1 week before and 1 month after LMS. Such evaluation included perceptual ratings of breathiness and strain (using the GRABS scales) and aerodynamic measurements. Aerodynamic measures included maximum phonation time (MPT), mean expiratory airflow (MEAF), mean peak air pressure (MPAP), aerodynamic resistance (ARES), aerodynamic efficiency (AEFF), and the ARS. All aerodynamic measures were compared pre- and post-LMS. Additionally, three patient subgroups (improved, worsened, and unchanged) were identified by reference to changes in the breathiness and strain ratings pre- and post-LMS. The aerodynamic measures of the three subgroups were compared.
Results
All aerodynamic measures including the ARS improved significantly after LMS. The three groups did not differ significantly in any aerodynamic measure except the ARS.
Conclusions
The ARS, a newly developed slope parameter, changed after LMS, and differed among the three subgroups divided by their strain ratings after LMS. Thus, the ARS identifies a strained voice.
INTRODUCTION
Phonation occurs when vocal fold vibrations are initiated and maintained by an interaction between the respiratory and phonatory systems [1]. The vocal folds must be in good condition for the voice to be satisfactory. Pathological conditions of the vocal folds are associated with voice deterioration. Voice disorders include alterations in vocal fold closure or muscle activation during vocal fold vibration; patients seek to compensate for the lack of appropriate vocal fold closure [2]. Increased vocal effort is often perceived as a strained voice, whereas incomplete adduction of the vocal folds may cause a breathy voice. However, these are not the only factors affecting voice quality. Voicing habits are also in play. Some speakers habitually produce a strained voice [3], generated when the vocal folds are ‘pressed’ or ‘squeezed’ during phonation, associated with high tension and insufficient airflow [4]. Such hyperfunctional voice patterns can trigger vocal lesions including nodules and polyps.
Vocal polyps, the most common benign lesion of the superficial layer of the true vocal folds, are associated with rough, breathy, or strained voices [5]. It is widely believed that phonotrauma of the vocal tissues is the primary etiology of vocal polyp development. Vocal abuse, misuse, and overuse are frequently claimed to cause vocal polyps, although polyps may also develop after a single traumatic incident, such as yelling at a football game [6]. In other words, it is generally held that vocal hyperfunction is an important underlying component of vocal polyp formation. Such hyperfunction is assumed to reflect increased and poorly regulated laryngeal muscle tension. Imbalances and increases in such tension render the vocal folds abnormally stiff.
Benign lesions of the larynx that do not respond to medical and/or speech therapy are often treated via phonosurgery, termed laryngomicrosurgery (LMS) [7]. It is important to avoid tissue trauma and to offer careful postoperative care. LMS can be used to complete vocal adduction and maximize the vibratory amplitude. The voice can be rendered less breathy, but some patients may still have strained voices after surgery, associated with habitual or compensatory phonation, which can trigger recurrence of vocal lesions.
Many researchers have explored airflow, air pressure, and laryngeal resistance in patients with voice disorders. Higher mean flow rates (MFRs) are associated with hypotensive laryngeal conditions and lower MFRs with hypertensive conditions [1,2,8]. Such aerodynamic measures are strongly associated with perceptual voice quality ratings, including breathiness and strain [2]. As breathiness increases, airflow rates also rise and subglottal pressures fall, whereas an increase in strain is associated with lower airflow rates, higher subglottal pressures, and increased glottic resistance. In other words, perceived breathiness is associated with insufficient vocal fold adduction, whereas perceived strain is indicative of hyper-adducted vocal folds. However, breathiness and strain may co-occur in patients with vocal polyps. The glottal gap attributable to the lesion increases airflow rates. To minimize the glottal gap and impr ove the voice, the vocal folds become tensioned and over-adducted as the patient seeks to compensate for the lesion. Thus, in addition to any pre-existing habitual hyperfunction, the airflow rates decrease. Therefore, the aerodynamic parameters of such patients do not clearly reflect the vibratory pattern or phonatory behavior.
The maximum phonation time (MPT) is commonly used to evaluate the respiratory and phonatory mechanisms. The MPT is reduced when the subglottal airflow is inefficiently used at the glottis. Although the MPT is a simple yet useful indicator of phonatory ability, the MPT does not reveal vocal fold over-adduction. A recent aerodynamic and laryngeal imaging study of patients with vocal palsy [9] revealed that those exhibiting over-adduction of healthy vocal folds during phonation did not differ significantly in terms of either the MFR or MPT compared to those who did not exhibit over-adduction. Thus, vocal fold over-adduction in patients exhibiting hyper-functional phonation is not clearly revealed by aerodynamic measures, particularly when a lesion is present. It is necessary to derive a dedicated parameter revealing whether vocal folds with lesions (polyps in the present study) are over-adducted under tension, and whether such patients have a habitual hyperfunctional voice pattern.
The new parameter fulfilling these requirements is the airflow regression slope (ARS) derived from airflow features measured during the MPT. The ARS yields precise information about the vibratory patterns of the vocal folds. The ARS reflects the rate at which the airflow falls with time. A steep slope means that airflow is high as phonation commences, but decreases rapidly thereafter, whereas a flat slope means that the airflow is constant during the entire MPT.
The ARS is generally negative because of declining over time. Generally, vocal polyps are associated with a large absolute ARS, shown in a steep slope. After the polyps are surgically removed, the ARS flattens. However, ARS values will not change after surgery in patients with habitual or compensatory, hyperfunctional voice patterns. Therefore, the ARS detects both vocal fold condition and hyperfunctional voice habits.
In patients with voice disorders, aerodynamic measures including the MPT, airflow rate, subglottal pressure, and laryngeal resistance are strongly associated with perceptual features of voice quality, including breathiness and strain [2]. Also, the ARS is related to voice strain.
The goals of the present study were to: (1) investigate changes in aerodynamic parameters, including the ARS, before and after LMS; (2) identify aerodynamic parameters associated with perceptual auditory ratings of voice changes, particularly strain, before and after LMS; and (3) explore whether the ARS can detect hyperfunctional voice patterns.
METHODS
Patients
Patients who consented to our use of their voice data obtained at the Chungnam National University Hospital from March, 2015 to May, 2016, were eligible for inclusion in the present study. The establishment and subsequent use of the voice database was approved by the Institutional Review Board (permit no. CNUH-2016-06-013). Patients diagnosed with vocal polyps by an otolaryngologist/head-and-neck surgeon and who underwent LMS were included in the study. Before surgery to remove vocal polyps, and at 1 month after surgery, voices were evaluated by a speech-language pathologist (SLP). Before surgery, all patients underwent behavioral interventions to improve vocal hygiene. Additionally, they were instructed not to speak at all for 7 days after LMS and to only gradually increase daily phonation thereafter.
Patients with hearing aids, any respiratory illness at the time of voice evaluation, and/or any history of phonosurgery were excluded. Finally, we included 39 patients (14 males and 25 females) between the ages of 19 and 76 years (median=47.62 years, SD=12.20 years); all had histologically proven vocal polyps. The pathology was unilateral in 35 cases and bilateral in 4. All males had unilateral lesions; 84% (21/25) of females had unilateral lesions and 16% had (4/25) bilateral lesions.
Auditory-perceptual ratings of voice quality
Voice was evaluated before and after LMS by an experienced SLP. Voice evaluation included auditory-perceptual ratings and aerodynamic measurements.
For auditory-perceptual ratings, all patients were instructed to read a ‘Gael (=autumn)’ paragraph at a comfortable pitch and loudness and at a normal rate. Each voice was recorded using a CSL platform (model 4150B, KayPENTAX Corp, Lincoln Park, NJ, USA) and was perceptually evaluated in real time (i.e., during the reading) by the SLP. Auditory-perceptual ratings of voice quality were graded using the GRBAS scales, with a particular focus on breathiness and strain, because breathiness and strain correlate with vocal polyp lesions and habitual phonation characteristics. The range of each scale was from 0 (normal) to 3 (severe).
A total of 78 voice samples recorded pre- and post-LMS were evaluated twice by the SLP to allow intra-rater reliability to be measured. The Pearson correlation coefficients were 0.646 (p <0.001) for breathiness ratings and 0.614 (p <0.001) for strain.
The pre-LMS breathiness ratings of the 39 patients were 0 [8 cases, (20.5%)], 1 [19 cases, (48.7%)], 2 [11 cases, (28.2%)], and 3 [1 case, (2.6%)], respectively. The breathiness ratings post-surgery were 0 [26 cases, (66.7%)] and 1 [13 cases (33.3%)] (Figure 1). The number of patients with scores of 0 increased after surgery, indicating that overall breathiness decreased. The strain ratings before surgery were 0 [7 cases, (17.9%)], 1 [28 cases, (71.8%)], 2 [3 cases, (7.7%)], and 3 [1 case (2.6%)], respectively. The strain ratings after surgery were 0 [11 cases, (28.2%)] and 1 [28 cases, (71.8%)]. No patient had a score of 2 or 3 (Figure 1). Thus, overall strain decreased after surgery.
Auditory perceptual ratings for breathiness (top) and strain (bottom) in 39 patients with vocal polyps pre- and post-LMS.
Patients were divided into three subgroups based on changes in the auditory-perceptual ratings (improved, worsened, and unchanged voice quality after LMS). In terms of breathiness ratings, 24 patients (61.5%) improved, 1 (2.5%) worsened, and 14 (35.8%) were no different. In terms of strain, 10 patients (25.6%) improved, 3 (7.6%) worsened, and 26 (66.6%) were no different.
Aerodynamic measurements
All patients were aerodynamically evaluated using the Phonatory Aerodynamic System (the PAS 6600, KayPENTAX Corp, Lincoln Park, NJ). The parameters evaluated were the MPT, mean expiratory airflow (MEAF), mean peak air pressure (MPAP), aerodynamic resistance (ARES), aerodynamic efficiency (AEFF), and the ARS. MPT, MEAF, and the ARS were measured during the MPT task. MPAP, ARES, and the AEFF were measured during the voice efficiency task. During all tasks, each patient was instructed to hold the PAS with both hands and to press the facemask firmly against the face, covering both the nose and mouth. The examiner held the top of the mask around the bridge of the nose to prevent air escape.
For the MPT task, all patients were asked to take a deep breath through the mouth, press the facemask firmly against the face, and then produce a sustained vowel /a/ at a comfortable pitch and loudness for as long as possible.
During the voice efficiency task, all patients were instructed to press the facemask firmly against the face with an oral-tube between the lips, to take a deep breath through the nose, and then to repeat the syllable /pa/ seven times using a single breath. The five central syllables were subjected to analysis. All patients watched demonstrations by the examiner and practiced several times prior to evaluation.
All aerodynamic measures except the ARS were automatically calculated, but the ARS was manually calculated. The ARS was the linear regression of the slope of the amount of airflow over each 0.005 second during the entire MPT. The PAS printed long lists of airflows in L/ 0.005 s; the ARSs were calculated using these lists. The X axis represented time and the Y axis represented airflow in liters. The regression formula was:
where × is time, χ̄ the mean of x, y the amount of airflow, and ȳ the mean of y. Most ARSs were negative because the patients were not inhaling. Therefore, the regression slope was taken to be the absolute value. If that value was greater, the slope would be steeply inclined and phonation would feature less airflow and increased vocal effort.
Figure 2 shows a flat airflow declination pre- and post-surgery in the same patient. Figure 3 shows a steep airflow declination pre-and post-surgery in another patient, who thus retained a hyperfunctional phonatory habit even though the lesion had been removed. These figures show that habitual phonatory characteristics did not change when pathological vocal fold lesions were surgically removed. Therefore, the ARS reflects vocal effort as a phonatory characteristic.
An example of flattened airflow declination as revealed by PAS during maximum phonation (A: pre-LMS, B: post-LMS of the same patient).
Statistical analysis
All statistical analyses were performed with the aid of IBM SPSS software (version 22.0 for Windows; IBM Corp., Armonk, NY), and the level of significance was set at p<0.05. For measures that were not normally distributed, a non-parametric equivalent test for paired comparisons (the Wilcoxon Signed Rank Test) was used to compare aerodynamic measures pre-and post-LMS.
Differences in aerodynamic measures pre- and post-LMS were calculated, and those for each of three subgroups (improved, worsened, and unchanged voice quality) in terms of breathiness and/or strain rating were compared using the Kruskal-Wallis test. If a significant difference among the three groups was apparent, the Tukey HD post-hoc correction was applied to identify the pair of groups that differed significantly.
RESULTS
Pre-and post-LMS comparisons
All aerodynamic measures exhibited non-normal distributions. Therefore, among-subgroup differences were assessed using the Wilcoxon Signed Rank Test. Statistically significant differences were apparent for the MPT (Z=−3.042, p =0.002), MEAF (Z=−2.656, p =0.008), ARES (Z=−2.819, p=0.005), AEFF (Z=−2.805, p =0.005), and ARS (Z=−3.628, p <0.001) in pre- and post-LMS. Table 1 lists the medians, means, and SDs of all aerodynamic measures. The ARES, AEFF, and ARS medians increased, whereas those of MPT, MEAF, and MPAP decreased, after LMS.
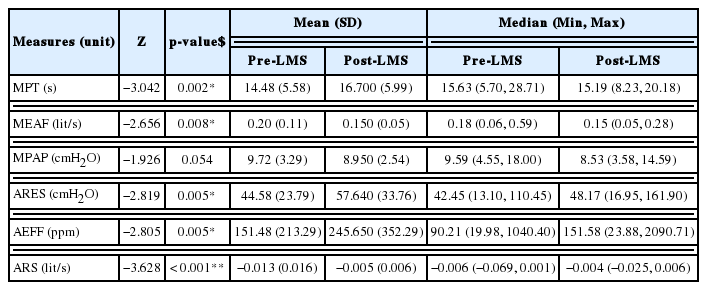
Comparisons between pre- and post-LMS for aerodynamic measures
In terms of breathiness, the Kruskal-Wallis test revealed no significant difference in any aerodynamic measure (Table 2). Table 3 lists the means and standard deviations of the pre- and post-LMS parameters in the three subgroups divided by changes in breathiness and strain ratings. However, all three subgroups exhibited similar tendencies in terms of the mean changes in aerodynamic measures from pre- to post-LMS. In terms of breathiness ratings, the mean values of the MPT, ARES, AEFF, and ARS of all three subgroups increased after LMS, whereas the mean MPAP values decreased. The mean MEAFs decreased in patients who improved and unchanged group after LMS, but increased in the single patient who worsened (one case only; this result is thus not meaningful).

Comparisons of difference values between pre- and post-LMS among three groups divided by changes in breathiness ratings
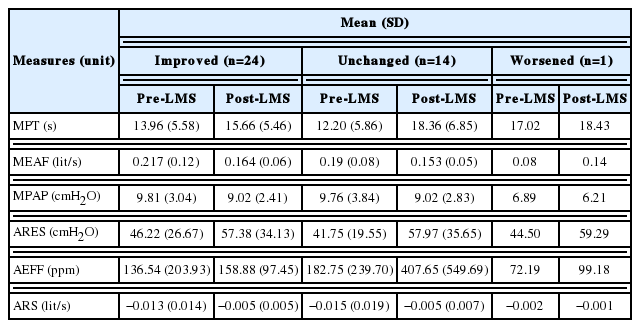
Means and SDs of pre-and post-LMS in three groups divided by changes in breathiness ratings
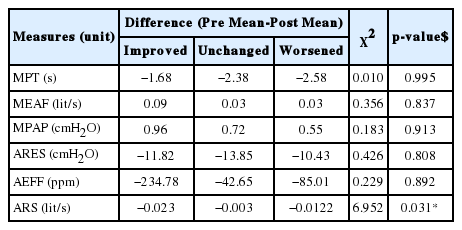
In terms of strain ratings, the ARS exhibited the only significant difference (χ2=6.952, p =0.031) among the three subgroups (Table 4). When the strain ratings of those who improved and unchanged were compared, the Tukey HD-corrected significance level met the p <0.001 criterion. The means of the MPT, MEAF, ARES, AEFF, and ARS increased in all three subgroups after LMS, but that of the MPAP decreased (Table 5).
Comparisons of difference values between pre- and post-LMS among three groups divided by changes in strain ratings

Means and SDs of pre-and post-LMS in three groups divided by changes in strain ratings
DISCUSSION
Effect of LMS on aerodynamic measures
Aerodynamic measures reflect the vibratory behavior of the vocal folds and are strongly associated with changes in vocal conditions. In the present study, all aerodynamic features of patients with vocal polyps changed after LMS. The mean values of the MPT, glottal resistance, vocal efficiency, and ARS increased; those of the MFR and subglottal pressure decreased.
A recent study [10] of vocal changes before and after LMS in patients with vocal polyps reported changes in aerodynamic measures, including falls in the MFR and subglottal pressure, explained by complete closure of the vocal folds after the polyps were removed by LMS [7]. Also, glottal resistance increased when a mass was removed, improving both vocal efficiency and voice quality. Improvements in glottal closure after LMS improved the voice despite the slight reduction in voice amplitude caused by surgery.
Unsurprisingly, the ARS (an aerodynamic measure) reflected changes in vocal conditions, as did other objective aerodynamic parameters. After LMS, the absolute ARS value decreased, indicating that the airflow slope flattened. Thus, the airflow was less strong early in phonation and was well-controlled by the vocal valve.
Aerodynamic measures and perceptual ratings: Breathiness and strain
We found no significant among-subgroup differences in terms of breathiness pre- and post-surgery. Thus, no measured aerodynamic variable was sensitive to changes in the auditory-perceptual breathiness ratings.
The three subgroups divided by changes in strain perceptual ratings pre- and post-surgery differed significantly only in terms of the ARS, which distinguished between those with no change and those who improved, in terms of strain, after LMS. The ARS was a robust indicator of strain voice quality. In other words, the ARS directly measured hyperfunctional vocal effort (e.g., muscle tension dysphonia). The ARS not only changed after surgery, but also varied among the three subgroups in parallel with their strain perceptual ratings. The new slope parameter identifies a strained voice.
Some speakers habitually produce a ‘pressed’ or ‘squeezed’ voice before vocal surgery and such squeezed voice continues after removing vocal lesions. From ARS result of our study, we suggest that we can predict those who need a voice therapy following surgery, and strain ratings can be measured not only subjectively but also objectively via ARS parameter.
We did not record smoking histories or laryngoscopic findings such as excessive glottal and/or supraglottic medial contractions, anterior-posterior contraction of the supraglottic musculature, or excessive bowing of the vocal folds. Therefore, we could not evaluate the causes of strain. However, strain ratings improved in 10 cases and did not change in 26 (the largest subgroup). This suggests that strain voice quality is affected by factors other than operative treatment. Such factors may include elevated vocal effort, habitually incorrect phonation, vocal abuse, or poor vocal hygiene including smoking.
One limitation of our study is that all data were derived from a single patient population which was not normalized; also, we had no control group. Our results must therefore be interpreted with caution. Another limitation is that several clinical and morphological factors including the size, shape, color, and location of polyps were not noted. These factors may affect voice quality. Nevertheless, our population was relatively homogeneous. In future, we plan to enroll more subjects and to conduct longer-term follow-up to better evaluate the utility of ARS measurement in patients undergoing LMS and/or voice therapy.
CONCLUSION
We found significant pre-and post-surgery differences in five aerodynamic measures of patients with vocal polyps. The MPT, MFR, glottal resistance, and glottal efficiency increased, and the subglottal pressure decreased, after LMS. The ARS flattened after LMS, indicating that airflow was controlled during phonation. Additionally, the ARS differed among three subgroups divided by changes in the strain ratings after LMS. The ARS, an aerodynamic measure, identified a strained voice.
ACKNOWLEDGMENTS
This work was supported by the Ministry of Education of the Republic of Korea and the National Research Foundation of Korea (NRF-2016S1A5B6914201).