


INTRODUCTION
The slow time-intensity modulation of the speech envelope, defined as fluctuations in the overall amplitude at rates between about 2 Hz and 50 Hz, can convey important linguistic information, manner of articulation, the presence of voicing, and some prosodic information [1]. The importance of these temporal envelope cues to speech perception has been demonstrated because it is believed that the cues can be treated as the only information available to people with severe or profound sensorineural hearing loss and for cochlear implant (CI) users [2–5]. If listeners with severe or profound hearing loss can only utilize limited fine spectral and temporal information [6], temporal envelope or amplitude modulated speech information could play an important role for speech perception [7]. It is critical for CI users to detect and process these temporal envelope cues for their everyday perception because conventional signal processing implemented on most of the current clinical CI sound processors is based on temporal envelope signals extracted from overlapping frequency regions [8]. As such, extensive studies with temporal envelope cues have been conducted as a simulation of electric hearing for CI users [4,9,10].
As most studies have been heavily focused on applying the use of temporal envelope information for better understanding of CI listening, the basic understanding of the temporal envelope information in normal auditory system is fundamentally lacking. It is unclear how normal auditory filters process the temporal envelope cues, which acoustic features are robust or weak to the temporal cues and to noise, and how speech perception in a normal auditory system will be influenced, compared to that of natural speech. Such a data set would be a good addition to existing CI simulation data.
In normal auditory system, there are higher numbers of independent frequency bands available [12,13], compared to the optimal number of frequency channels in CI listening. In most CI related studies, speech perception was assessed with the temporal envelope of stimuli, extracted with optimal numbers of channels which are much broader than the independent frequency bands in normal auditory filters. Two previous studies used psychoacoustic-driven auditory filters to assess the effect of temporal cues on speech perception. Drullman et al. [12] tried to extract temporal envelope information using various numbers of auditory filter bands (i.e., 6 1-oct, 12 ½-oct, and 24 ¼-oct) with 0, ½, 1, 2, 4, 8, 16, 32, or 64 Hz low-pass filter (LPF) cutoff frequency in frequency ranges from 100 to 6,400 Hz. They measured the effects of LPF cutoff frequency on vowel, consonant, and sentence perception. A severe reduction in speech perception was observed, particularly with lower cutoff frequencies, compared to speech scores reported by the other studies in which the temporal envelope of stimuli was extracted with a few wide bands [9–11,14]. Van der Horst et al. [13] extracted temporal envelop information from 26 critical auditory bands, suggested by Glasberg and Moore [15], modulated with speech-shaped noise, and temporally degraded by notch filtering (0–20 Hz). Performance in consonant recognition was in range of Shannon’s two-band condition [4] and approximately 15 percentage points lower, compared to scores reported by the other studies in which the temporal envelope of stimuli were extracted with a few wide bands [4,16,17].
The two studies discussed above [12,13] demonstrated that the effect of the temporal envelop information on speech perception depends on how the temporal envelope information was extracted. To add more detailed information to the two previous studies, we designed the current study to better understand the role of temporal modulation in phoneme recognition in noise. Specifically, we aimed to investigate the nature of the loss of temporal envelope cues, extracted from the psychoacoustic-based method on phoneme perceptual confusions in normal hearing (NH) listeners as a function of the signal-to-noise ratio (SNR). The following specific approaches were applied to achieve that aim. First, temporal envelope cues were extracted from a psychoacoustic-driven auditory filters in order to exclude fine spectra based on psychoacoustic auditory filter banks because a similar manipulation of the processed temporal envelopes extracted from the wideband signal does not guarantee that the narrow-band envelopes are filtered in the same way [12,13]. Second, we measured the ability of NH listeners to process the relevant temporal envelope cues as a function of SNR since none of the aforementioned studies that measured speech perception with temporal envelope cues uses SNR in their measures. Third, the use of temporal envelope cues was tested with multiple talkers to test NH listeners. Finally, we measured confusion matrices (CM) to define the nature of speech recognition loss provided by temporal envelope cues processed by normal auditory system.
METHODS
Subjects
The participants for the study were 19 adults with normal hearing (12 females, 7 males; mean age of 21; SD=3.58). All participants had normal hearing with pure-tone thresholds of less than 15 dB HL at octave intervals from 250–8,000 Hz, in both ears. All were native speakers of American English. All subjects read and signed the consent document to indicate informed consent to participate in this study. The basic ethical protection of human subjects in this research has been reviewed and approved by the University of Illinois at Urbana-Champaign Institutional Review Board.
Stimuli
The stimuli were 16 nonsense consonant-vowel (CV) syllables with the common vowel /a/, as in “father”, distributed by the Linguistic Data Consortium at The University of Pennsylvania [18]. The consonants include /b, d, f, g, k, m, n, p, s, t, v, δ, ∫, θ, ʒ, z/. Eight of 16 CVs were spoken by five talkers, and the other eight CVs were spoken by another five talkers, resulting in 80 tokens in total. Nonsense syllables were used to control for contextual effects.
Signal processing
To extract temporal envelope cues from normal auditory system, we used the derivation of auditory filter shapes from notched-noise data, reported by van der Horst [13] and Glasberg et al. [15]. First, the original wideband speech signal (sampling rate of 16 kHz) was passed through a bank of elliptic bandpass analysis filters, covering the range from 100 Hz to 6,500 Hz. The transition bands of the filters were at least −40 dB/octave. The amplitude envelope from each band was computed by means of a Hilbert Transformation. The signals were low-pass filtered to temporally degrade the envelopes with cutoff frequencies of 4 Hz, 8 Hz, 16 Hz, and 32 Hz, along with those processed with no temporal filtering (NF), which resulted in a generation of five experimental stimulus conditions. The envelope derived from each band was then used to modulate white noise, limited by the same bank of bandpass filters used for the original speech signal. Finally, the modulated noise bands were summed, and the resultant signals were presented in real time to the listener. The bandwidth and center frequencies of each analysis filter are given in Table 1.
Signals of different SNR were generated in the following way: The rms of the reconstructed waveform (after temporal degrading) was scaled so that the standard deviation after was the same as the standard deviation before filtering (the original waveform). Then, the waveform was scaled based on the SNR, and the two components were added together. The resulting signal was presented once the stimulus was set to the most-comfortable-listening levels. All signal processing was performed in Matlab (MathWorks, Natick, MA).
Procedure
Stimuli were presented in a 16-alternative, forced-choice format with a graphical user interface. SNR was varied depending on the stimulus condition and purpose of the test segment. SNRs for the NF and LPF conditions were set based on the results of a pilot study indicating the SNRs at which performance just superseded chance level (1/16=6.25%) but was below 20%. SNRs tested for the LPF conditions were −12, −6, 0, 6, 12 dB, and Quiet, whereas SNRs tested for the NF condition included −8, 0, 8, 16, 24 dB, and Quiet.
Stimuli were presented to the right ear (ER-2 insert earphone [Etymotic]) with sound levels controlled by an attenuator and headphone buffer (TDT system III) at the most-comfortable-listening level for each listener. For each stimulus presentation, a CV and a SNR were selected from the array of syllables and SNR indices and were randomized without replacement. No direct feedback was given for individual stimuli.
For the NF condition, there were 480 trials in total (16 CV×5 talkers×6 SNRs), evenly distributed into four blocks. Each speech condition was repeated three times in order to obtain an appropriate sample size (number of presentation of each CV) for each CV at each SNR. For the LPF conditions, there were 16 blocks, each containing 120 trials (1,920=480 trials [4 blocks]×4 LPF conditions). Each set of four blocks for each of the LPF conditions was presented only once, as the row sum under these conditions was sufficient for the confusion pattern to be clearly observable. For each LPF condition and each SNR, a 16×16 CM was constructed. CMs were regrouped as a function of SNR and of LPF cutoffs, and data was analyzed. The complete test protocol required nine to 12 hours with enough break time over three to four visits.
Data analysis
Univariate analyses of variance (ANOVA) were conducted to determine the main effect of “SNR” and “LPF condition” on the grand mean error scores (Figure 1). Two-way repeated ANOVA was used, along with Tukey HSD multiple comparison analyses if the main effect was significant. Since SNRs used for the LPF conditions and the NF condition differed, we used linear interpolation using “interp1”, the standard Matlab function, to find Pe(SNR) values for NF at matched SNRs with other LPF conditions. The outcome of these analyses was assessed with a significance level of .05.
RESULTS
Grand mean error function, Pe=1-Pc
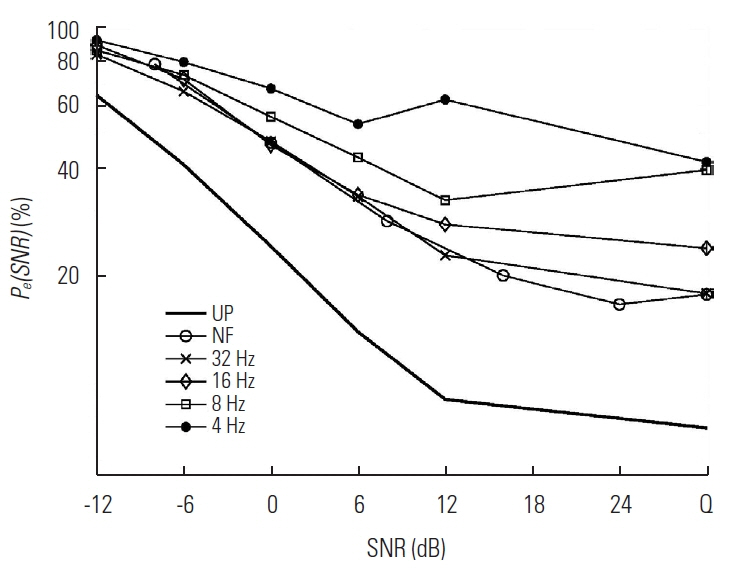
The grand mean percent error, Pe(SNR), was computed as a function of SNR with LPF conditions, and the result of this computation is given on Figure 1. Note that SNRs tested for LPF conditions are −12, −6, 0, 6, 12 dB, and Quiet and for NF are −8, 0, 8, 16, 24 dB, and Quiet. For the purpose of comparison, performance scores on the same 16-consonants used for the current study, but unprocessed (UP), whose purpose was to repeat Miller and Nicely’s [19] experiment with more talkers, SNRs, and different corpus in normal hearing, were also plotted, indicated as thick-solid line with no symbol.
The Pe(SNR) for the NF and two higher LPFs was similar at SNR<6 dB, while the Pe(SNR) for the lower two LPFs was always higher than other LPFs at SNR >−6 dB. To evaluate the effect of SNR, a two-way repeated measure ANOVA was performed. The main effect of SNR was significant (F(5,326)= 46.78, p<0.001). A post hoc (Tukey HSD) tests showed significant differences Pe(SNR) between most adjacent SNRs (p<0.05) at each LPF. The main effect of LPF cutoff was significant (F(4, 242)=39.54, p<0.001). At the SNR of −12 dB, post hoc (Tukey HSD) test showed the significant difference in the Pe(LPF) between 4 Hz LPF and each of NF, 32 Hz LPF and 8 Hz LPF (p<0.001). At the SNR of −6 dB, Pe(LPF) differed significantly on the following pairs: between 32 Hz and each of NF, 8 Hz, and 4 Hz; between 4 Hz LPF and each of 8 Hz LPF and 16 Hz LPF (p<0.05). At SNRs of 0, 6, and 12 dB Pe(LPF) for NF, 32 Hz LPF, and 16 Hz LPF each differed significantly from 8 Hz LPF and 4 Hz LPF (p<0.05). In addition, the Pe(LPF) was significantly different between 8 Hz LPF and 4 Hz LPF at SNRs=0 dB, 6 dB, and 12 dB (p<0.001). The effect of the temporal modulation, except at LPF=4 Hz, was similar between 12 dB and quiet as shown above for Pe(LPF). Thus, the disadvantage of reducing temporal envelope modulation is marked at LPFs<16 Hz for all SNRs, but −12 dB where performance is poor overall. Wilks’s Lambda with Sphericity confirmed that there was a significant interaction between SNR and LPF (p<0.05).
Individual error function per CV, Pe(i)(SNR)=1-Pc(i)(SNR)
The aim of this section is to compute the individual error function per CV, that is, Pe(i)(SNR)=1-Pc(i)(SNR), and to add more information about the processed consonant perception in noise. The individual error function Pe(i)(SNR) can provide information such as (a) which CV is perceived least accurately, that is, Pe(i)(SNR) >Pe(SNR), (b) how each CV is influenced by LPF conditions and SNR, and (c) whether CVs can be grouped relative to the grand mean percent error Pe(SNR), and if so, whether CV groups show similar error patterns as a function of LPF and SNR stimulus conditions.
Based on this computation, the 16 CVs were placed in the three sets to demonstrate the effect of the temporal manipulation of speech envelope on CV recognition, as shown in Figures 2–4. The three error sets were defined as follows.
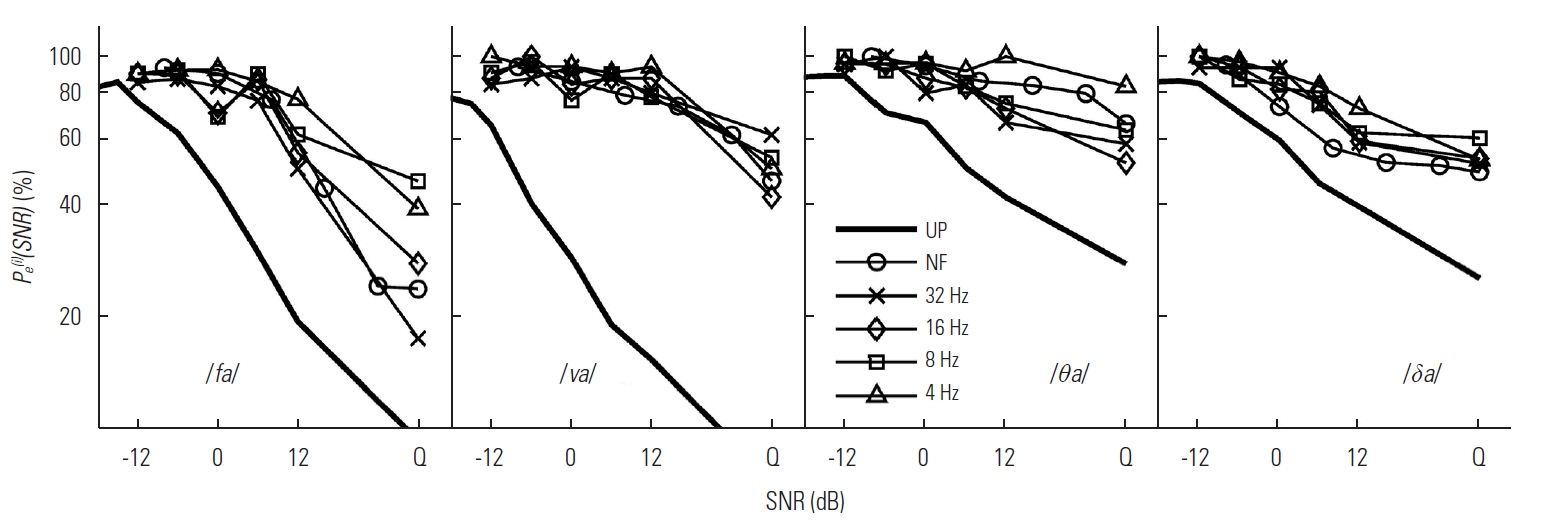
The difficult or D set is defined as CVs whose percent error is consistently higher than the grand mean percent error across LPF conditions, that is, Pe(i)(SNR) >Pe(SNR). Four CVs-/fa/, /va/, /θa/, and /δa/-included in the D set (Figure 2).
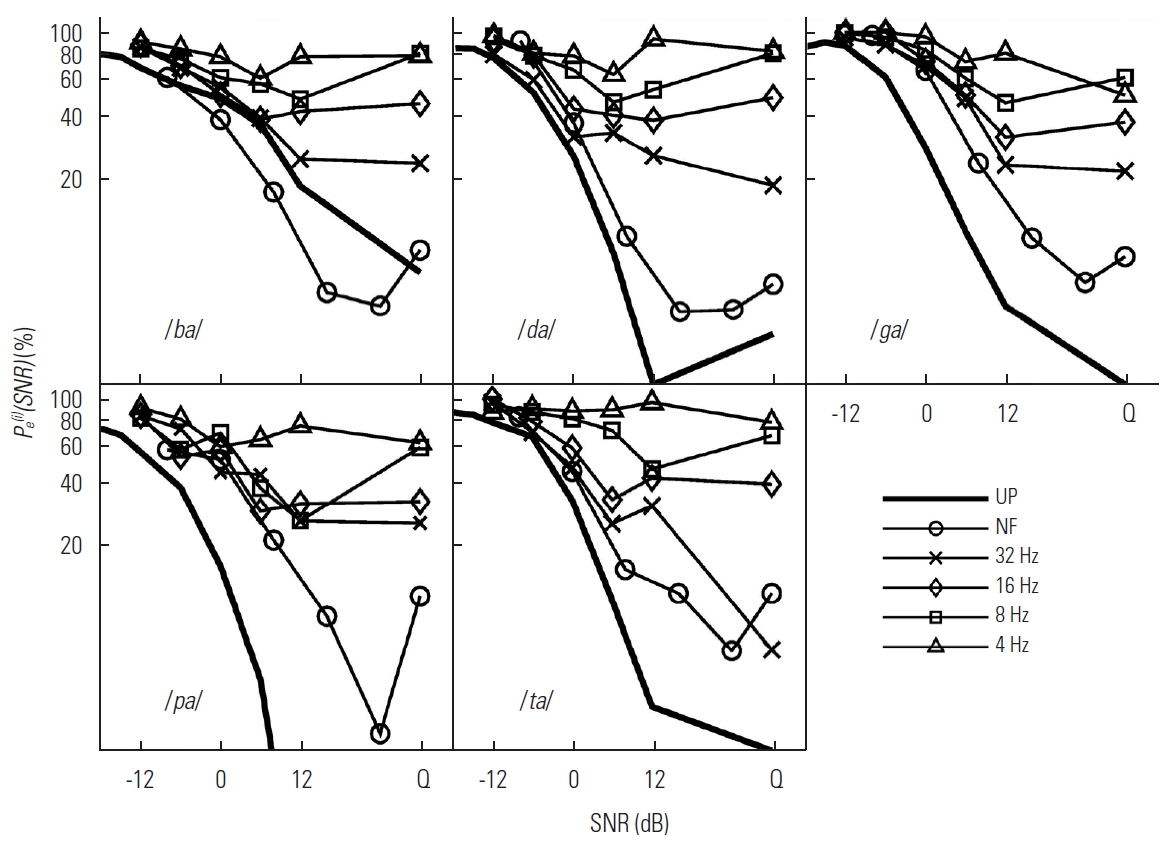
The moderate or M set is defined as CVs whose Pe(i)(SNR) varies relative to Pe(SNR) depending on LPF condition. Five CVs-/ba/, /da/, /ga/, /pa/, and /ta/-included in the M set (Figure 3).
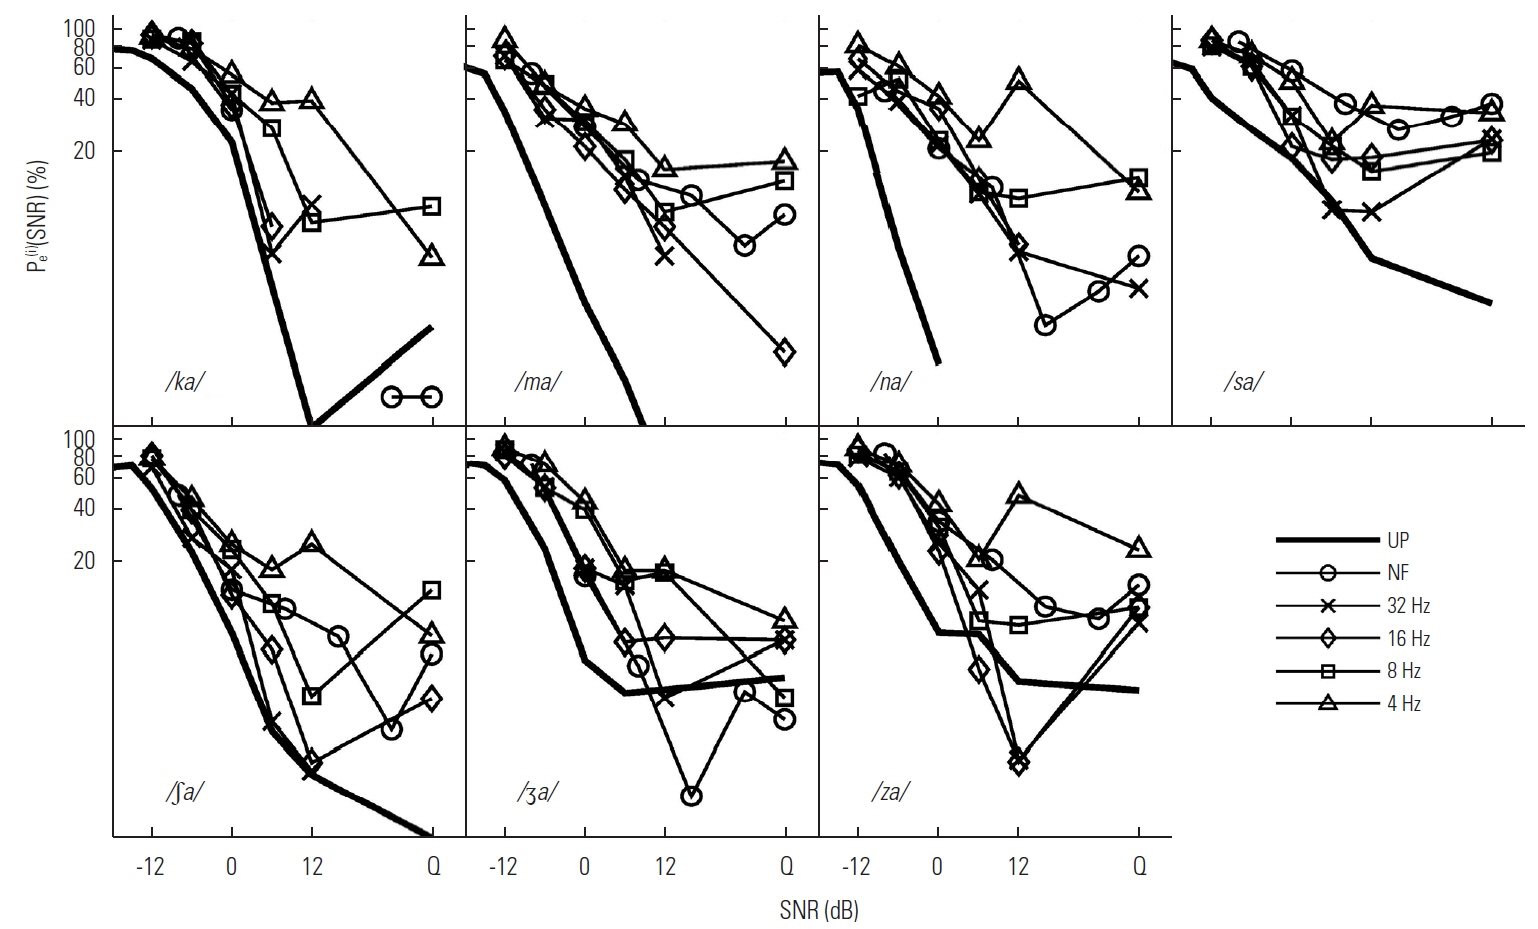
The easy or E set is defined as CVs whose percent error is consistently lower than grand mean percent error across LPF conditions, that is, Pe(i)(SNR)<Pe(SNR). Seven CVs-/ka/, /ma/, /na/, /sa/, /∫a/, /ʒa/, and /za/-included in the E set (Figure 4).
The individual error functions for the D set (/fa/, /va/, /θa/, and /δa/) are presented in Figure 2. The common characteristic of the error functions was the minimal effect of LPF cutoffs, particularly at SNRs<6 dB. Specifically, the difference in Pe(i)(SNR) was approximately 10% between the best condition (mainly, NF or 32 Hz LPF) and the worst condition (4 Hz LPF) up to 6 dB SNR, meaning that increasing SNR aids minimally in performance up to 6 dB SNR for all CVs and LPF conditions. For example, the Pe(i)(SNR) for /va/ remained relatively steady for NF and all LPF conditions from −12 dB to 12 dB SNR, after which it dropped sharply from 85% to around 50% in quiet. The perception of /fa/ was most positively aided by an increase in SNR from 6 dB to 12 dB. The Pe(i)(SNR) for /θa/ showed the least improvement with increasing SNR and seemed high for the NF relative to 32 Hz, 16 Hz, and 8 Hz LPF conditions across SNRs. The difference in Pe(i)(SNR) between the best performance for the processed conditions and the UP condition was evident in the D set. The largest difference in Pe(i)(SNR) between the best performance for a processed condition and the UP condition was observed for /va/, ranging from 10% to 60%, especially in the middle range of SNRs.
The effect of LPF cutoffs and SNRs were marked on all 5 CVs in the M set, as shown in Figure 3. The error function of each CV was clearly affected by LPF cutoff, resulting in the lowest probability of the error for the NF with systematically increased errors as LPF cutoff was decreased. The individual error functions for the M set were also reduced by raising SNR, especially up to 6 dB SNR. At SNRs >6 dB, Pe(i)(SNR) behaved uniquely depending on CVs and LPF cutoffs. For both NF and 32 Hz LPF, Pe(i)(SNR) for /ba/, /ga/, and /pa/ was reduced by increasing SNR until it reached its asymptote at 12 dB SNR, whereas Pe(i)(SNR) for /da/ and /ta/ reached its asymptote at SNR=6 dB. For 16 Hz LPF, Pe(i)(SNR) for CVs /ba/, /da/, /pa/, and /ta/ each reached its asymptote at SNR=6 dB, whereas Pe(i)(SNR) for /ga/ decreased up to SNR=12 dB, then reached its asymptote. For the 8 Hz LPF condition, decreases in Pe(i)(SNR) with increasing SNR for all 5 CVs reversed as SNR increased from 6 dB or 12 dB to quiet, showing an approximately 25% increase in errors. For the 4 Hz LPF condition, Pe(i)(SNR) for all 5 CVs increased as SNR increased from 6 dB to 12 dB by 10% to 40%, then decreased in quiet. Compared to the UP condition, there was larger difference for the NF and the LPF processed CVs, but the error probability for the NF was similar to ones with the NP condition across the CVs in the set.
The patterns of Pe(i)(SNR) for CVs in the E set were similar to those in the D set, in terms of minimal effects of LPF cutoff<6 dB, as shown in Figure 4. From −12 dB to 6 dB SNR, the difference in Pe(i)(SNR) was less than 12% among LPF conditions across SNRs for all 7 CVs. In contrast to the D set CVs the slope of Pe(i)(SNR) was relatively steep for the E set CVs indicating a greater effect of SNR on performance. The Pe(i)(SNR) decreased marginally with increasing SNR >6 dB for all LPF conditions except the 4 Hz LPF condition. Three interesting observations should be made about the data from the E set CVs. For the NF stimuli, the error probabilities for target CVs /ma/, /sa/, /∫a/, and /za/ were higher than those for 32 Hz and 16 Hz conditions at SNR >0 dB. This was especially evident for /sa/, which showed an error probability function that was similar to that for the 4 Hz LPF condition. The other observation was that the 4 Hz LPF error probability function for CVs /na/, /sa/, /∫a/, and /za/ increased at SNR=12 dB re SNR=6 dB. The detailed confusion pattern analysis will demonstrate the reasons for this result. Finally, the Pe(i)(SNR) for the UP CVs was approximately 15% higher than that for the best condition, mainly NF, of the processed condition for /ka/, /ʒa/, and /za/ at SNR<6 dB, but was similar at >6 dB. For two nasals, Pe(i)(SNR) was approximately 20% higher for the UP that than for NF at<12 dB, but similar in quiet. In addition, Pe(i)(SNR) of /∫a/ was very similar, while that of /sa/ was approximately 25% higher for the UP than that for 32 Hz at SNR<0 and in quiet.
Confusion pattern analysis
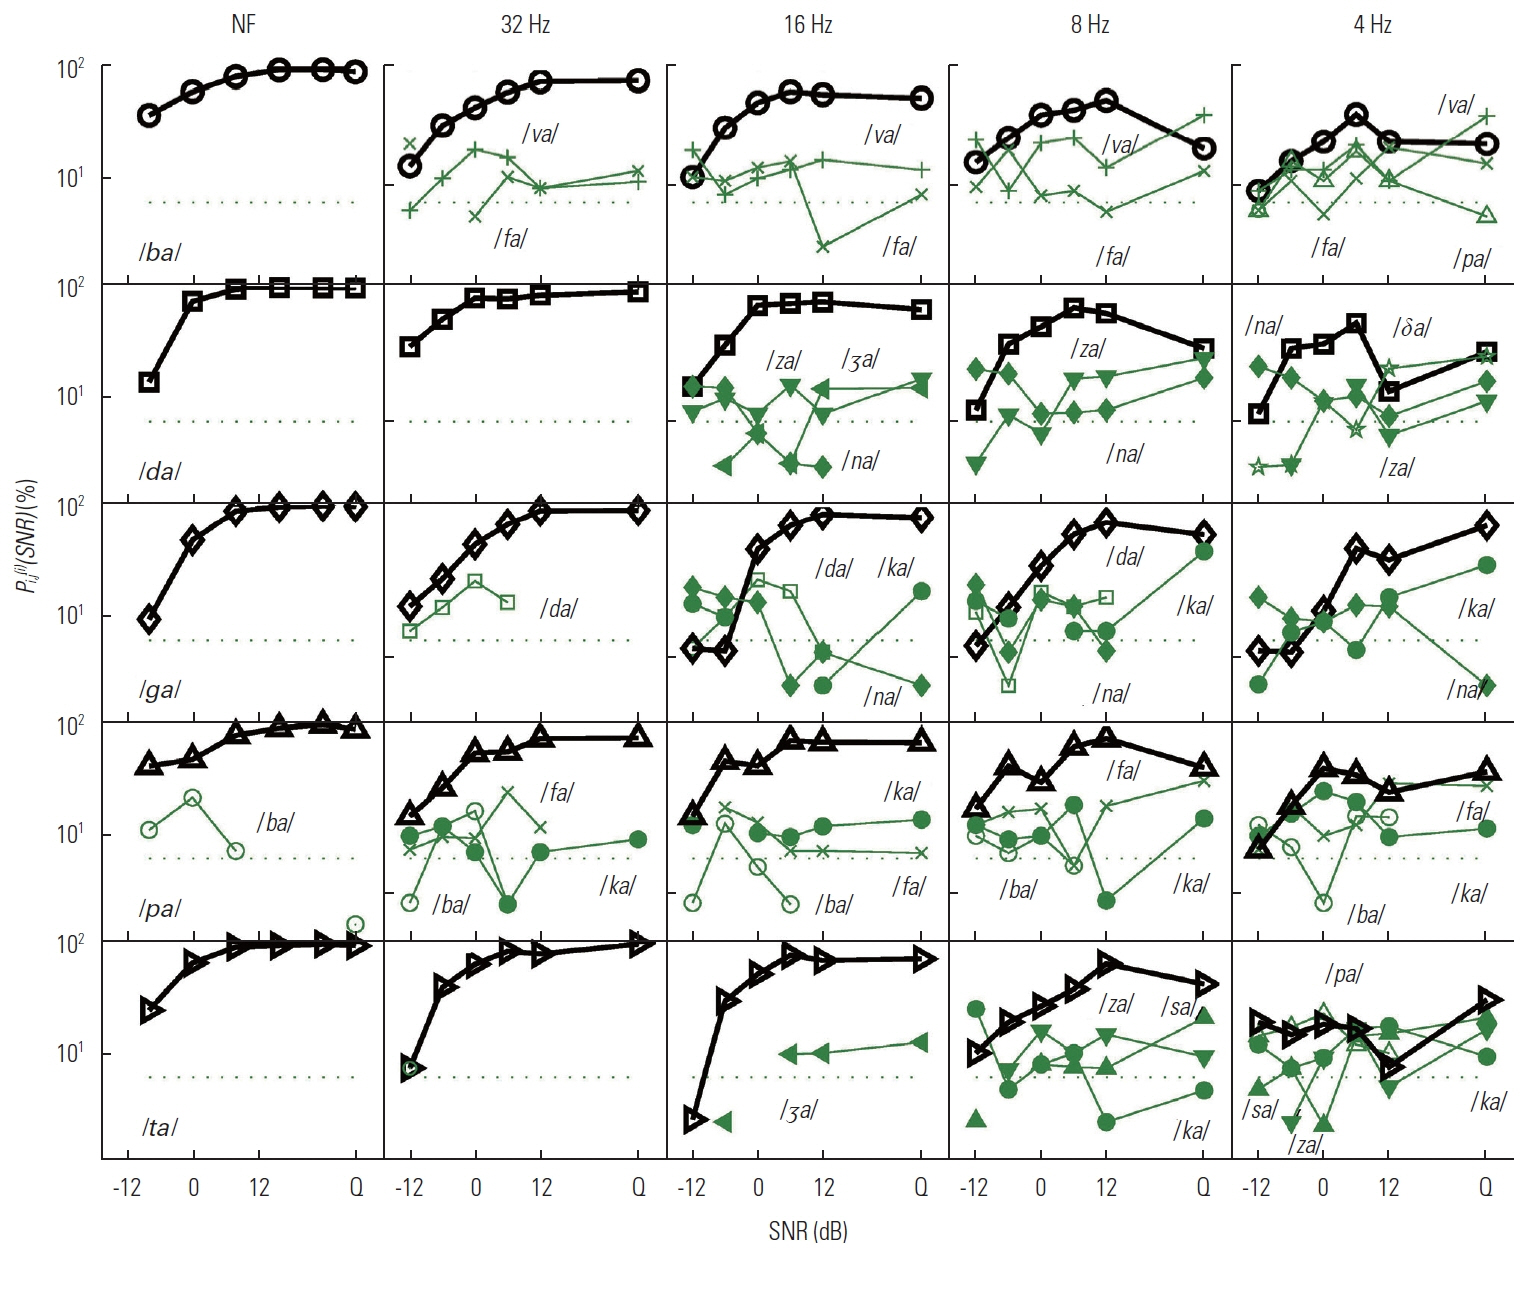
One of our goals for the current study was to define the nature of speech recognition loss provided by temporal envelope cues processed by normal auditory system. In this section, we provide key details about how the D, M, and E sets are related to each other and why discrimination scores for certain CVs are poorer or better using confusion matrices analyses. The results of the confusion analysis for the D, M, and E sets are given in Figures 5–7, respectively. For these three figures, all dependent values are plotted on a logarithmic scale as a function of SNR. The target CV is given in the panels of the first column, and each LPF condition is given as a title above each panel of the first row. Each panel presents the confusions for each LPF cutoff condition in order of reducing temporal modulations from NF to 4 Hz LPF (from left to right). The percent correct, Pc(i)(SNR) for the target CV is denoted as a thick solid curve with an assigned symbol, defined in Table 2, whereas the percent errors for each non-target CVs or competitors are indicated as a dotted line with assigned symbols as shown in Table 2. Only competitor CVs with error probabilities higher than chance level (1/16=6.25%; horizontal-dotted line on each panel) are shown. CVs that are major competitors are labeled on each panel as well.
The D set
The panels of the first row in Figure 5 show the confusions when /fa/ was spoken. The common competitors included two M set CVs /ba/ and /pa/ and the D set CV /va/ for all LPFs. The confusion patterns of the primary competitor /ba/ were similar across LPF conditions. In contrast, the confusions of the second major competitor /pa/ were more dependent on LPF, especially for 4 Hz where competition from /pa/ is greatest. As a third D set competitor, the error probability of /va/ was lower than those of /ba/ and /pa/ but was much more consistent across SNR and never reached below chance level even in quiet.
The second row shows the confusions for the target /va/. The CVs /ba/, /fa/, and /ma/ were consistent, major competitors across LPF conditions. The M set CV /ba/ was the primary competitor for NF and the 32 Hz LPF conditions, whereas the E set CV /ma/ was the primary competitor for other LPFs. For all LPF conditions except for NF, the D set CV /fa/ was the primary competitor in quiet. The M set CV /pa/ was confused with the D set target /va/ only at LPF ≤8 Hz.
For the target /θa/, the most confusions came from /ba/, /fa/, and /pa/. The E set CVs /ka/ and /sa/ were observed as competitors only for 32 Hz and 4 Hz LPF, respectively. Whereas the D set CV /va/ competed under NF and 4 Hz LPF, /δa/ competed under NF and the two lower LPFs. The M set CVs /ba/ and /pa/ were the primary competitors at SNR<12 dB for NF and the two higher LPFs and for the two lower LPFs, respectively, but the D set CV /fa/ became the primary competitor in quiet for all LPFs. The typical confusions of M set CVs /ba/ and /pa/ were high for SNR<0 dB, but gradually reduced to chance as SNR increased across LPF conditions.
For the target /δa/, most confusions came from /da/ and /na/ across LPF conditions. The confusions of /na/ were gradually reduced as SNR increased for NF and 32 Hz, whereas the probability of the error increased inversely as SNR increased, especially at SNR >6 dB for the lower LPFs. The M set /da/ was the most competitive CV across SNR for 32 Hz. Additionally, /va/ and /θa/ were confused with the target /δa/ for NF and 32 Hz LPF, and /ga/ and /ma/ were confused with the target for 8 Hz and 4 Hz LPFs.
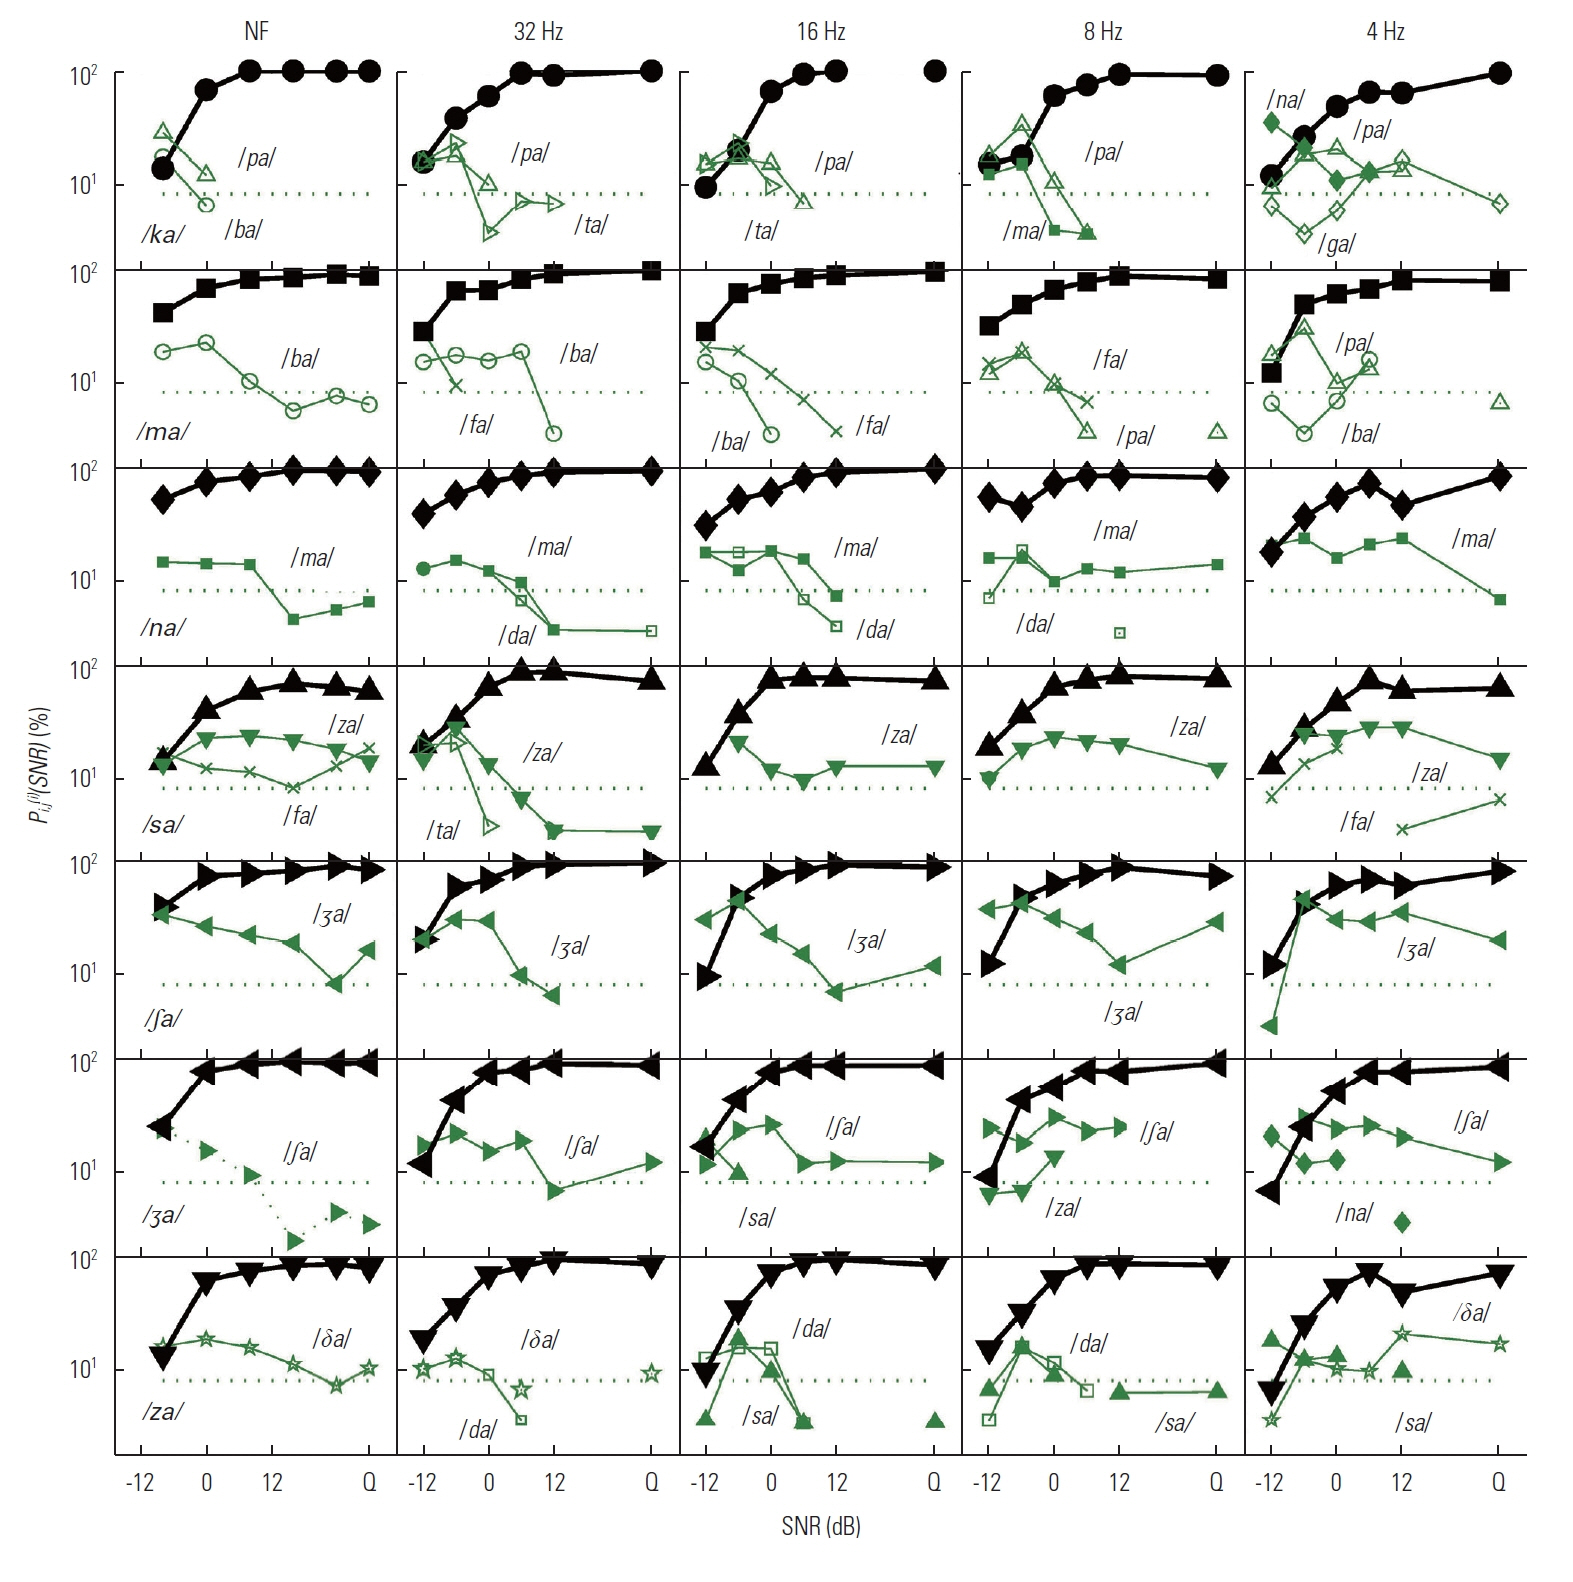
The M set
The first row of Figure 6 shows the confusions for the target /ba/. The two D set CVs /fa/ and /va/ were the primary competitors for all LPF conditions. Confusions with both /va/ and /fa/ were not clearly resolved by increases in SNR. The error probability for /va/ increased as the temporal modulation decreased, especially in quiet for the two lower LPFs. The CV /fa/ competed with the target at just above chance level for 32 Hz and 16 Hz LPFs at SNR<0 dB, but the error probability increased in quiet for the two lower LPFs. Thus, two additional CVs were confused with the target /ba/ at the lower LPF condition. Error probability for /pa/ was evident with 4 Hz.
For the target /da/, there were no competitors above chance level across SNRs for NF and 32 Hz LPF. For the lower three LPFs, the major confusions came from two E set CVs /na/ and /za/ across LPFs and the D set /δa/ for the lower two LPFs, especially ≥12 dB SNR. The CV /na/ was a major competitor at SNRs<0 dB, whereas /za/ was a major competitor at SNRs >6 dB. For the target /ga/, there was no competitor for the NF. For other LPFs, the CVs /na/ and /da/ were the primary competitors at SNRs<6 dB, while /ka/ was the primary competitor at SNRs >6 dB. The confusions with /ka/ and /na/ increased with a decrease in LPF, but confusions with /da/ were more consistent across LPFs.
As shown in the fourth row, the most common CVs competing with the target /pa/ included /fa/, /ba/, and /ka/, and an additional M set CV /ta/ was added to the confusions for only the 32 Hz LPF condition. The competition with /ba/ was prominent at SNR<6 dB across LPF conditions, whereas that with /fa/ and /ka/ was prominent at SNR >6 dB with increasing error probabilities for higher SNRs. For the target /ta/, there were no major competitors for NF or the two higher LPFs, whereas the E set /ka/, /sa/, and /za/ were major competitors for the two lower LPFs. The error probabilities of /sa/ and /za/ increased progressively from below chance levels and peaked at 20% in quiet for both 8 Hz and 4 Hz. The CVs /sa/ and /za/ tended to compete more with /ta/ at SNRs >6 dB. Competition with /ka/ and /pa/ became most prominent for 4 Hz LPF.
The E set
The confusions for the E set are given in Figure 7. Most confusions with the target /ka/ were resolved at SNR<6 dB with a common main competitor of /pa/ across LPFs. Additionally, the M set /ta/ was added as a mild competitor at SNR<−6 dB for 32 Hz and 16 Hz, whereas two nasals, /ma/ and /na/ were added as mild competitors for 8 Hz and as a major one for 4 Hz at SNR<−6 dB. For the target /ma/, CVs /ba/, /fa/, and /pa/ competed with the target. However, most confusions with these competitors were progressively reduced as SNR increased and finally resolved at SNR<0 dB for all LPFs. For the target /na/, the other nasal /ma/ was the primary competitor across LPFs along with the M set /da/ for three middle LPFs at SNRs ≤6 dB. The error probabilities of these competitors were progressively reduced as SNR increased, and most confusions were resolved at SNR <6 dB.
The primary competing syllable for the target /sa/ was the E set /za/ for all LPF conditions. The D set CVs /fa/ for NF and 4 Hz and M set CV /ta/ for 32 Hz also competed with /sa/. For the target /∫a/, there was a single E set competitor /ʒa/ for all LPFs. Its confusions gradually diminished with increases in SNR, but the error never fell to chance level for all LPFs. The major confusion for the target /ʒa/ came from a single competitor of /∫a/ across LPF conditions. The confusion patterns were similar for three higher modulations with /∫a/ showing little influence on performance at SNRs above 8 dB. On the other hand, for the two lower LPF conditions, the confusions continued up to 12 dB, accounting for roughly 25% of the error, and the error never fell to chance level for 4 Hz. For the target /za/, the M set /da/ and the E set /sa/ were most common competitors along with a sound /θa/. The confusions introduced by /da/ and /sa/ were resolved at SNR >0 dB. This result shows that the D set CV /δa/ competed more at SNR <10 dB for NF but more at SNR >10 dB for 4 Hz.
Information transmitted
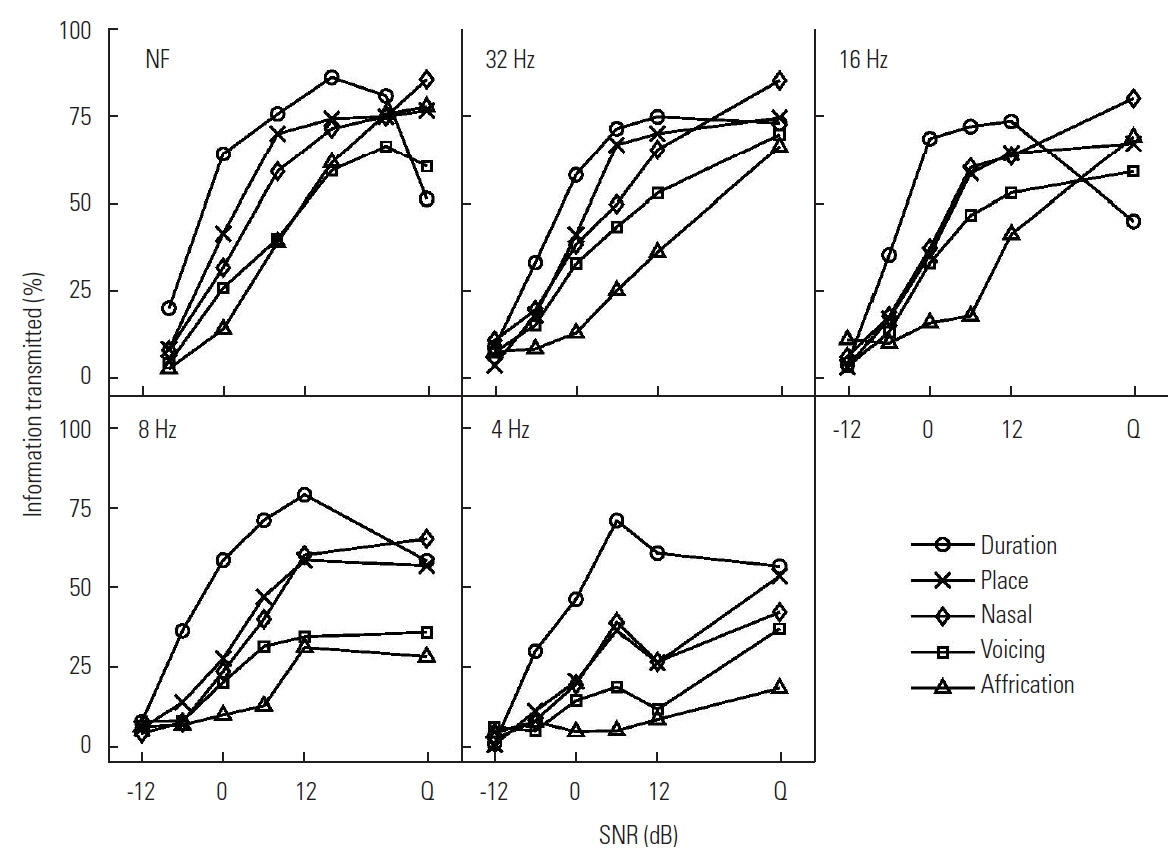
Figure 8 shows how much information was transmitted via the following acoustic features of: duration, voicing, nasality, affrication, and place of articulation for each of LPF conditions. The information transmitted (IT) was calculated using the approach used in Miller and Nicely [19] and Van Tasell studies [20,21]. There were two overall trends in the IT for the feature system. The amount of IT was represented from greatest to least in the order of duration, place, nasality, voicing, and affrication for all LPF conditions. The main effect of decreasing temporal modulation of the speech envelope through LPF was a reduction in IT.
One interesting observation for the NF condition was that the amount of the IT was similar for place and nasality and similar for voicing and affrication. For the 32 Hz LPF condition, the difference in the IT was relatively small at the lowest SNR and in quiet, but a larger difference was noted at the middle of the SNRs tested. The IT patterns for the 16 Hz LPF condition are similar to those for the 32 Hz LPF condition except for large variations in the quiet condition and the 8Hz LPF looks similar to 16 Hz LPF. The IT for duration showed a drop in quiet as seen for other conditions. The IT for place and nasality was almost identical across SNRs. As expected, the IT for 4 Hz LPF was the lowest for each of the features, even though the overall patterns of the IT were similar to those in higher LPF conditions.
To quantify how much the articulatory features helped consonant perception, we computed the percent of the variance attributed to the articulatory feature system (i.e., duration, place, nasal, voicing, and affrication). This was computed by summing the ratios between the IT of each feature and the total IT in bits for features [19–21]. The analysis shows that the feature system accounts for 38% to 90% of the variance from SNRs at −12 dB to quiet condition.
The statistical significance of a pairwise comparison of the percent of variance associated with LPF conditions at each SNR, as revealed by post hoc (Tukey HSD) at 0.05 significance level, are presented in Table 3.
DISCUSSION
The goal of the study was to assess the perceptual confusions taken from responses to 16 nonsense CVs processed by the 26-critical band noise vocoder and low-pass filtered at five different temporal modulation rates in noise. Our results reveal three error sets: set D (/fa/, /va/, /θa/, /δa/), set M (/ba/, /da/, /ga/, /pa/, /ta/), and set E (/ka/, /ma/, /na/, /sa/, /∫a/, /ʒa/, /za/). The M set was most influenced by the temporal modulation rate. The major confusions of set D were from two set D consonants (/fa/ and /va/) and one set M consonant (/ba/). In the M set, there were no confusions for NF and 32 Hz, but for LPF<32 Hz the confusions came from both within the M set and the D set. The major confusions from set E were from CVs within this set, and its confusions were similar from less than 4 Hz through 16 Hz LPF conditions. The results of the feature system analysis identify duration as the most robust feature to manipulation of SNR and LPF and affrication as the least robust feature.
The effect of signal processing on the grand mean performance
For the present study, to isolate the temporal envelope information as much as possible from the spectral information, the temporal envelopes were extracted from 26 critical bands. The grand mean error Pe is roughly 18% for the NF, the 32 Hz and 16 Hz LPF conditions and 40% for the 8 Hz and 4 Hz LPF conditions. Our results can be compared with van der Horst et al. [10] and Drullman et al. [12] since all used the same 26-critical band signal processing. Our Pe for the NF and two higher LPFs is lower than the Pe (29%) for the reference (i.e., NF) condition, reported by van der Horst et al. [13], who measured performance on 18 Dutch consonants in the /VCV/ context with three vowels. Their Pe=29% for the reference condition is similar to Pe for Shannon’s two-band processor [4]. Both our error rate and that of van der Horst [13] are higher than those reported in the studies where the temporal envelope information was extracted from a fewer number, but broader of signal processing bands, mainly ranging from four to eight bands. This finding exists in opposition to the general knowledge that more bands lead to higher spectral resolution and lower error, a difference that could be attributed to methodological differences in the extraction of the temporal envelope.
Drullman et al. [12] also reported that the spectral content extracted from the narrower processing bands becomes the long-term average spectrum of the utterance; consequently, more of the temporal envelope cues are removed. This indicates that 1) the temporal information extracted from the wideband speech signal still contains residual spectral information, helping to improve speech recognition, and 2) the manipulation of the temporal envelope should be performed on each individual narrower band so that the effect of lowering temporal modulation is correctly determined.
The error sets
Using the same criteria for the three error sets, there are two distinctive error sets for the UP data extracted from Allen’s study [18]. The first set includes /ba/, /fa/, /va/, /θa/, and /δa/ which are the same CVs, defined as set D in our processed condition, plus /ba/, a CV in set M in the processed condition. In the UP condition, the M and the E sets are not separated. It was noticed that the difference in the error probabilities of set M sounds were small. This categorization is comparable to that of the NF condition, showing only two error sets. In the UP condition, /θa/ and /δa/ are the most difficult sounds to perceive across SNRs, while the two nasals are the easiest sounds to perceive. These findings are consistent with those of the processed condition except for /sa/, which demonstrates high errors in the NF condition.
The comparisons of confusion patterns
One of the goals in the present study was to measure the perceptual confusions with the temporal envelope cues alone so that we can define the nature of the errors associated with the perception of the 16 processed, nonsense syllables in noise. The following discussion will provide a comparison of the perceptual confusions for the UP condition Allen generated [18] with the confusions of the present study. The UP data sets are selected for comparison because the perceptual confusion data, measured with the temporal envelope speech signals, do not currently exist. Furthermore, the UP is selected because the experimental conditions between the two studies are almost identical, including the same 16 CVs, white noise masker, and the same range of SNRs tested.
For set D consonants, the major competitors are similar between UP and the present study, but the confusions with these competitors are much higher for the processed condition than for the UP across SNRs. The error probabilities for the UP competitors gradually decreases as SNR is increased, whereas for the processed condition, the confusions with /ba/ increases at SNR <12 dB and those with /fa/, /va/, or /θa/ increased at SNR >12 dB. All UP CVs in the M set were discriminated from competitors at SNR<−12 dB. This comparison reveals that the major competitors are different between the UP and the current study, except for the case of the target /ba/. The confusions with competitors under the UP conditions were reduced with increasing SNR, but those for the processed condition did not demonstrate such a consistent effect across SNRs, especially at either SNR <6 dB or at SNR >6 dB. For set E consonants, the major competitors and confusion patterns were similar between two studies. However, for /ma/ and /za/ the major competitors were not similar, but the confusion patterns were similar between UP and the processed conditions.
The comparisons of the IT
The information transmitted (IT) in duration, place, nasality, voicing, and affrication for the UP data [18] was computed using the same feature system used for the current study. The general trend of IT in the UP condition was similar to that of the current study. For the UP syllables, the amount of IT by features was greatest for nasality, followed by duration, place, voicing, and affrication while the amount of IT under the temporally-processed condition was greatest from duration, followed by place, nasality, voicing, and affrication for all LPF conditions. The major difference between the UP and the processed conditions occurred for nasality (around 50%) and affrication (around 30%) across SNR. On the other hand, there was a less than 20% difference between the two conditions across SNRs for place, voicing, and duration, indicating that there is less articulatory feature information embedded in the temporal envelope of speech than in UP speech, especially for nasality and affrication. The difference in the percent of variance between UP and the processed condition was around 10% at higher SNRs and increased as SNR decreased, which implies that the articulatory feature system defined with the naturally spoken sounds can be used to define the processed syllables with a noise vocoder.
For all LPF conditions, three unexpected outcomes were observed: higher IT for place, lower IT for voicing, and the inversion of the duration cue transmitted at the SNR between 12 dB and quiet. Since this level of detail in consonant perception with noise vocoder processor is currently available in only our data set, we cannot determine if these unexpected outcomes had been observed in previous published studies that raised similar questions. What is known is that the place cue needs more spectral information [10]. It was reported that the IT for place in quiet was 50% [4] and >70% [10,17] with 4- and 16-channel noise-vocoder processor, filtered by 32 Hz LPF, respectively. Under the similar conditions in the present study, IT for place is 75%. Lower IT for place cue is expected because the temporal envelope cues, extracted from the 26-critical auditory bands, would carry extremely limited spectral information. In the current study, the IT for the voicing cue for the processed condition in quiet is 70%. It was reported that more than 90% of the voicing cue was transmitted even with only two processing bands [4,10]. Xu et al. [17] also confirmed the high transmission of voicing cues (>87.5%) with a 16-channel noise-vocoder, low-pass filtered by 32 Hz in quiet. These published results, including ours, indicate that some spectral information is embedded in the temporal envelopes, extracted from narrower but higher number of auditory filters.
The inversion of duration IT (i.e., 93% at 12 dB SNR and 73% in quiet) can be explained by the perceptual confusions. When each of the consonants used for the duration feature analysis (/sa/, /∫a/, /ʒa/, /za/) was presented in quiet, a target consonant was confused the most with one of other three consonants. This implies that the perceptual cues for these competitors are released from the noise masker, providing more choices to a listener for target selection. Despite reduced overall masking of the target syllable, this effect could lead to more confusions, resulting in an increase in the confusions for the target at that SNR.
Importance of the current data in CI studies
The results of the current study may provide control data for numerous cochlear implant studies that utilized acoustic simulations with a vocoder. The use of the temporal envelope cues of speech, the output of the vocoder, has been studied for speech recognition the last 10 years. Most CI simulation studies with a vocoder have been focused on determining the optimal number of channels for speech perception [4,17], the effect of the tonotopic mismatch produced by differences in CI electrode insertion depth [11,22–24], and the effect of the channel interaction on speech perception [25]. All these studies were administered with less understanding of the nature of the temporal envelope information processed in normal auditory system. It is important to know how the temporal envelope cues are processed by normal auditory filters before investigating into further details on the interactions between the temporal envelope cues and the CI related parameters such as the optimal number of channels. The data from the present study is a good addition to the existing CI simulation data and provides useful control data for various acoustic simulation studies which involve temporal envelope information.
CONCLUSION
Recognition of consonants processed to remove fine spectral features and subjected to LPF depends heavily on the SNR rather than the LPF. As opposed to the grant mean error, the confusion matrix analysis on each CV provided the internal structures of all the subjects’ responses (i.e., correct and incorrect responses) to the stimulus. Such information helped categorize the 16 CVs based on discrimination as a function of SNR and LPF cutoffs. Those most difficult to recognize were in set D (/fa/, /va/, /θa/, and /δa/), the intermediate level of recognition as set M (/ba/, /da/, /ga/, /pa/, and /ta/), and the easiest level of recognition which was set E (/ka/, /ma/, /na/, /sa/, /∫a/, /ʒa/, and /za/). This analysis also showed that the set M syllables are most affected by differences in the temporal modulation of the speech envelope, even at −12 dB SNR.
The comparisons between the unprocessed condition and the best condition (usually NF or 32 Hz) of the processed syllables confirmed that the major difference in performance derived mainly from the set D sounds; differences in performance ranged from 10% to 60% on average across SNR. In contrast, the difference in performance was less than 10% across SNR for sets M and E. This suggests that defining sources of confusions among set D sounds is critical to developing a way to resolve the confusions and leading to the improvement of speech recognition in noise.
The feature IT increases as both SNR and LPF cutoff frequencies increase. For all LPF conditions, duration is the most robust feature, whereas affrication is the least robust feature. The IT for nasality and place is similar. Three unexpected findings were: higher IT for place, lower IT for voicing, and the inversion of the duration cue transmitted at the SNR between 12 dB and quiet. The feature system accounts for up to 90% of the variance for consonant perception in the quiet condition.