Acoustic Characteristics of Fricatives /s/ and /∫/ Produced by Speakers with Parkinson’s Disease
Article information
Abstract
Purpose
This study investigated acoustic characteristics of fricatives produced in a repeated syllables task by speakers with Parkinson’s disease (PD), focusing on temporal, intensity, and spectral moment analyses.
Methods
Ten participants with PD and nine neurologically-healthy participants were asked to repeat the two words, sigh and shy, ten times in a row and at a comfortable rate. Acoustic measurements were made for duration and intensity of each fricative and vowel, plus four coefficients of spectral moments for the fricatives.
Results
Results indicated a varying effect of duration difference between group, with marginally shorter duration of fricatives but much shorter duration of vowels in speakers with PD, as compared to controls; comparable vowel-fricative intensity differences for the two groups; and for the group with PD relatively intact coarticulation throughout fricative.
Conclusions
The findings suggest considering the complex effect of overall speech rate on different kinds of segments in PD. The findings also have implications for speech stimuli in research on coarticulation.
INTRODUCTION
Prior research has indicated a number of speech deficits that typically accompany Parkinson’s disease (PD) such as imprecise consonants, distorted vowels, monopitch, monoloudness, and variable rate, which have been well-supported by acoustic and kinematic data over the past several decades (e.g., [1–3]). The current study focuses on imprecise consonants, particularly fricative production in this population as well as the relationship of these fricatives to following diphthongs. Fricatives have received much attention from researchers and clinicians in the field of communication disorders, partly because of their somewhat challenging articulatory gestures, requiring that air be forced through a narrow constriction for a relatively long period, ranging approximately between 80 ms and 180 ms [4,5].
The goal of the current study was to examine acoustic characteristics of sibilants /s/ and /∫/ produced by individuals with PD, especially focusing on their relative duration and intensity compared to that of the following vowel. Two acoustic aspects of fricative and vowel production were of specific interest: (1) segment duration, and (2) the relative segment intensity (expressed as an average intensity difference) between fricatives and adjacent vowels. A third acoustic measure, spectral moments, was applied to fricatives to address a question concerning coarticulation.
Fricative duration was included in our analysis because among the frequently-reported speech characteristics of people with PD, increased speech rate (hence, reduced speech segment duration) among some patients is considered a unique characteristic in PD; reduced speech rate is typical of almost all other dysarthrias. The current study focused not only on the fricative itself, consistent with previous work, but on the following vocalic duration to assess the proportional relations between fricative and vocalic durations, and whether those proportions were different for the two groups. Fricative intensity was included in our analysis in consideration of two speech characteristics of PD, reduced loudness and reduced phonetic contrast (often described as “blurred”, or “mumbling” speech, [6]). Special attention was directed to the intensity difference between fricatives and the following diphthong as one way to look at segmental contrasts between fricatives and a following vocalic nucleus. In normal speakers, the difference between vowel and fricative intensity has served as an acoustic contrast index with a 7–14 dB difference between consonants and vowels, the latter having the greater intensity [7–9].
Lastly, spectral moments analysis was selected for this study owing to its advantage over traditional approaches to measurement of fricative spectra such as peak frequency [10–12]. Spectral moments consider spectra as a distribution of numbers and compute parameters that describe the central tendency, dispersion, tilt and peakiness of the spectrum (M1, M2, M3, and M4, respectively; [9]). Prior research suggests that some spectral moments can be useful in capturing characteristics of fricatives. This is especially true for the /s/-/∫/ distinction (e.g., [10]). The current study, recognizing the relative lack of spectral moments data for speech produced by speakers with PD, also intended to provide M1 through M4 values of the two frequently-studied fricatives produced by this population.
Despite very few direct investigations of spectral moments of fricatives spoken by people with PD, slightly reduced spectral distinctiveness of /s/ and /∫/ compared to healthy controls has been observed [13]. A similar pattern of reduced spectral distinctiveness has been discussed for other dysarthria etiologies including ALS [10,14], and stroke [15]. Additionally, the change in M1 (the mean of the distribution) as a function of time, has been of interest as fricatives approach the following diphthong /∫/. The time change in moment values provides a way to examine anticipatory vowel coarticulation effects, in recognition that coarticulation disturbances are not well documented in the dysarthria literature. Although only one speaker (with no speech disorders) was examined, Soli [16] reported that temporal changes in fricative spectra served as sufficient cues for the following vowel when the fricative was isolated from its syllabic context in bi-syllabic FVFVF utterances.
In sum, this study sought to better understand fricative production (sibilants /s/ and /∫/) of speakers with PD, with emphasis on acoustic correlates of coarticulation and segmental contrasts, both of which are potentially important cues to speech perception and ultimately speech intelligibility. The use of simple repeated speech materials and sensitive acoustic measures was investigated to serve as the basis for an easily administered evaluation of speech motor control capabilities. The /s/-/∫/ distinction was chosen as a potentially productive contrast to study both because it has been used in previous work and was viewed as a good consonant complement to previous work on vocalic F2 transitions in repeated syllables [17]. This kind of work follows a tradition of investigating the acoustic characteristics of simple speech materials which may supplement and even call into question the speech motor control implications of perceptual evaluations (e.g., [18]).
METHODS
Speakers
Ten speakers with PD (5M, 5F) exhibiting mild to moderate dysarthria and nine neurologically-healthy control speakers (5M, 5F) were selected for this study from the archived LSU Motor Speech Database. The speakers ranged in age from 45 to 74 years for the PD group (median, 60) and from 38 to 72 years for the HC group (median, 60).
Speech severity of the participants was evaluated by six graduate students in the speech-language pathology program. Considering the short length of the speech material of the study, the Caterpillar passage [19] produced by the speakers was used for speech intelligibility ratings. Listeners were seated in the sound booth and asked to rate speech intelligibility on a 7-point scale. Speech intelligibility was defined as the degree to which the listener would easily understand exactly what the speaker said [20]. Listeners were instructed that higher numbers were to be used for more understandable passages, and lower numbers for less easily understood passages. The speech intelligibility scores ranged from 4.2 to 6.8 (median 5.4).
Procedures and analysis
Participants were asked to repeat the two words, sigh and shy, ten times in a row following the experimenter’s instructions, which yielded a total of 380 syllable productions (2 words×10 repetitions ×19 speakers). The recordings were made in a quiet room with a high quality microphone (AKG Perception 120 USB) at a sampling rate of 22 kHz with 16 bit quantization. The microphone was placed 15cm away from the mouth of the speakers. Prior to analysis, speech samples were low pass-filtered at 10 kHz.
For analysis, fricative onset was defined as the point in a digital spectrographic record where aperiodic noise first appeared in the high frequency range. Fricative offset was defined as the point of intensity minimum immediately prior to the onset of the periodic portion of the vocalic nucleus following the fricative [5].
The duration analysis used the boundaries defined above to determine segment durations, which are also reported below and expressed as vowel/consonant duration rations. Segment intensities were determined by averaging the intensity across each segment, with the averaging interval defined by the segments boundaries described above. This computation was performed by TF32, with an individual segment intensity expressed in decibels (dB) relative to an internal calibration level [21]. The dependent variable was the intensity difference between the vowel and preceding fricative.
Spectral analysis was limited to the final 100ms of the fricative to capture the transition of aperiodic spectral energy into the following diphthong /∫/. Coefficients for M1, M2, M3, and M4 were obtained from three 50-ms long windows of frication with 25 ms overlap between successive windows, using TF 32 [21]. These four coefficients served as indices of central tendency, diffuseness, symmetry, and peakedness of spectral shape of the fricatives of interests [9].
RESULTS
Results are presented according to each of the three aforementioned analyses: duration of the segments (and their intra-syllable differences), average intensity difference between vocalic nuclei and their preceding fricatives, and spectral moments.
Duration of Fricatives and Vowels
Table 1 presents descriptive results for duration and intensity of fricatives and the following vowel, separately by word. Two-way ANOVA results with group (PD and HC) and segment (fricative vs vowel) as the factors showed both main effects to be significant Group (F(1, 787)=38.61, p <0.001) and Segment (F(1, 787)=954.70, p <0.001), as well as a significant Group by Segment interaction [F(1, 787)=17.09, p <0.001]. In the case of both fricatives and vowels, the segment durations were shorter for PD as compared to HC, but the absolute difference was much greater for vowels (Table 1). The group difference for the two fricatives was 9–11 ms, whereas the corresponding difference for vowels was 49–50 ms; this is the source of the significant Group by Segment interaction. This interpretation is supported by a statistical comparison of the group ratios, pooled across the two words, of vowel to fricative durations. The average ratios (PD=2.22; HC=2.39) were significantly different by t-test (t(394)=1.974, p <0.05) (Table 1).
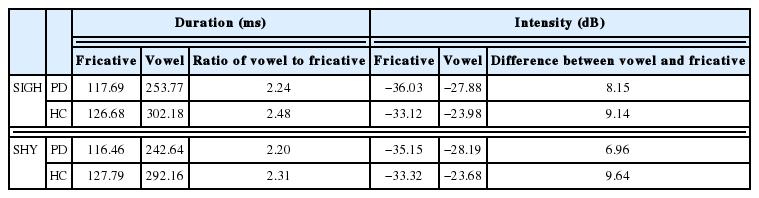
Descriptive results of duration and intensity of fricatives and vowels. Intensity differences are expressed as differences in dB down from an internal reference level within TF32.
Intensity Difference between Vowels and Fricatives
Two-way ANOVA revealed main effects of Group (F(1, 787)= 40.25, p <0.001) and Segment (F(1, 787)=267.24, p <0.001), but no significant interaction between the two factors. The intensity contrast measure between fricatives and vowels, as measured as the difference between the average intensities of the individual segments, was significantly less for the PD (mean=7.55 dB) compared to HC (mean=9.39 dB) (t(394)= 3.898, p <0.001 (Table 1)) group.
Moments Analysis
Table 2 provides means and standard deviations of moment coefficients for each measurement window. Window 1 refers to the farthest 50 ms interval of fricative noise from the offset, Window 2 to the next 50 ms interval closer to the vowel and overlapping Window 1 by 25 ms, and Window 3 to the 50 ms interval whose right-hand boundary was at the offset of frication noise. Unlike duration and intensity data, moment analysis was conducted separately for each gender because at least some studies have reported significant differences between male and female speakers for some moment coefficients [22–24]. Separate three-way ANOVAs were conducted for M1, M2, M3 and M 4 to examine the main effects of Speaker (PD vs HC), Word (sigh vs shy), and Window (Window 1 vs 2 vs 3) in addition to interactions among the variables.
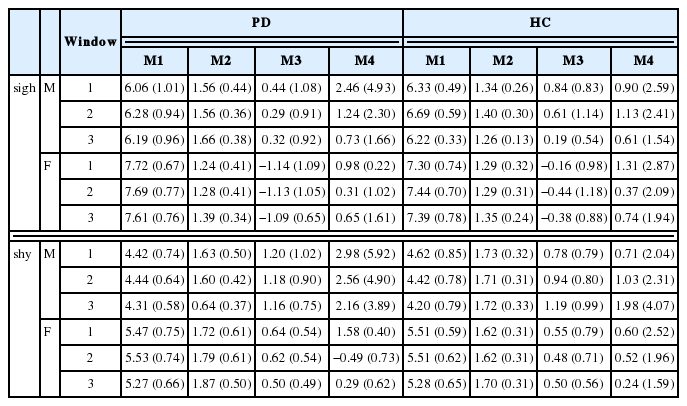
Descriptive statistics, mean (standard deviation) for spectral moments measured at three measurement windows (Window 1–3). M1 and M2 values are in Hz, while M3 and M4 are dimensionless.
A. M1
For males, three-way ANOVA results indicated a significant effect of Word [F(1, 491)=584.95, p <0.001], but not of Group or Window (Window 1 through 3). No significant interactions were revealed.
For females, ANOVA results showed significant effects of Group [F(1, 554)=5.76, p <0.05] and Word [F(1, 554)=1249.31, p <0.001]. The Speaker by Word interaction was significant [F(1, 554)=6.97, p <0.01].
As an objective measure of spectral distinctiveness between /s/ and /∫/, the M1 coefficient difference between the two segments were computed [25]. For each speaker, the mean of M1 was averaged across repetitions and windows and the individual difference in M1 between the two words were computed. As expected, M1 was higher for /s/ as compared to /∫/, this being the source of the main effect of Word. T-test results indicated no significant difference between the speaker groups [t(18)=0.17, p >0.05]. In addition, M1 transition from Window 1 to Window 3 was estimated for both words as its downward slope approaching the following vowel, which did not differ between the two speaker groups (Figure 1).
An example of M1 transition for SHY. Men and women data are separately plotted due to the gender effect. Window 1 refers to the 50ms window farthest from the fricative offset, while Window 3 refers to the 50ms window at the fricative offset.
B. M2
For males, there were main effects for M2 of Group [F(1, 491)=5.26, p =0.022] and Word [F(1, 491)=34.28, p <0.001], but not of WINDOW. In addition, there was a significant interaction between Group and Word [F(1, 491)=25.67, p <0.001].
For women, all three factors had significant effects; Group [F (1, 554)=4.44, p <0.05), Word [F(1, 554)=145.87, p <0.001], and Window [F(1, 554) =3.73, p <0.05]. In addition, the Speaker×Word [F(1, 554)=5.31, p <0.05] interaction was significant.
C. M3
For men, Word was the single significant factor for M3 [F(1, 491)=27.36, p <0.001]. A significant interaction occurred between Group and Window [F(2, 491)=17.81, p <0.001]. For women, Group [F(1, 554)=13.53, p <0.001] and Word [F(1, 554)=169.62, p <0.001] were significant main effects Finally, the Group by Word interaction was significant [F(1, 554) = 20.06, p <0.001].
D. M4
For M4, Group [F(1, 491)=7.67, p =0.01] and Word [F(1, 491)= 4.37, p <0.01] were significant main effects for males; the same main effects were significant for women (Group F(1, 554)=8.13, p <0.001] and Word F(1, 554)=13.534, p <0.001).
DISCUSSION AND CONCLUSIONS
The current study looked at a consonant-vowel syllable repetition task in which the consonants were lingual fricatives /s/ and /∫/ and the vocalic sound was the diphthong /∫/. Fricatives are often considered to have relatively high speech motor control demands, which fit the purpose of exploring a simple test of speech motor control integrity that might be applied in adults. A similar exploration of this concept was reported earlier for the case of second formant transitions in several different vocalic nuclei [26]. The current evaluation of possible speech motor control differences in this repeated syllable task was performed for patients with PD and a control group of healthy speakers.
Several different acoustic measures were extracted from the syllable repetitions, the measures designed to assess different possible aspects of speech motor control. Individual segment durations, in the current case fricative and diphthong durations, as well as their ratio in individual syllables, were computed for their sensitivity to articulatory rate and rhythm control. The average intensity difference between the fricative and diphthong segment of each syllable was obtained to reflect the complex sequencing of constriction tightness for the fricative followed by the integrity of the voice source for diphthongs, generated by the vibrating vocal folds. Under the assumption that the pressure generated by the respiratory system does not change for the fricative and diphthong within a CV syllable, the CV intensity difference most likely reflects the sequenced tightness of the lingual fricative constriction and the goodness of vocal fold adduction during phonation for the diphthong. As lingual fricatives become less tight, the acoustic source intensity generated at the exit of the constriction and in the vicinity of the downstream teeth should decrease; similarly, as closure for each cycle of vocal fold vibration becomes less complete, the voice source intensity should decrease. Finally, spectral moments were used to evaluate coarticulatory effects in the CV syllables. Presumably, coarticulation reflects the coordination between the successive gestures for consonant and succeeding vowels.
The results of the present study suggest certain group differences between the repetitions of these fricative-vowel syllables. First, the ratio of vowel-to-fricative durations, computed within syllables and averaged across the syllable repetitions, was significantly greater for the healthy control group as compared to the speakers with PD (Table 1). Although both fricative and diphthong durations were shorter in speakers with PD (see [25], for similar findings), fricative durations in the PD group were marginally shorter than those of healthy controls, whereas vowel durations in the PD group were (for this task) much shorter. Several studies have reported a complex effect of PD on consonant and vowel duration. Despite the general agreement on shorter consonant durations in PD as compared to HC [27–29], vowel duration has been reported as shorter [29], longer [13,30] or similar [31] to healthy controls. Careful examination suggests that the inconsistency may come from heterogeneity of speech characteristics (particularly, speech rate of the PD group and segment type (e.g., articulation manner/place) and perhaps variation of speech severity across studies.
In the current study, the difference in the way PD appears to affect the duration of individual segments in a simple CV syllable may reflect a speech motor control difference in rhythm, if the temporal organization of a CV syllable is assumed to be a relevant measure of this aspect of speech motor control. The temporal analysis should be repeated with other types of consonants and vowels, to eliminate the possibility that the greater vowel-to-consonant duration ratios in HC speakers are due to differences at the segment level, rather than relationship of the two segments composing the syllable. For example, a long-standing view of segment durations is that obstruents such as the fricatives studied in the current experiment are resistant to extreme shortening; vocalic sounds are not [32]. Perhaps the articulatory changes consequent to neuromotor disease follow the same rules, at least until the speech motor deficit is so severe that typical rules no longer apply.
Second, although vowel-fricative intensity differences within syllables were typically larger for healthy controls, as compared to speakers with PD, the group differences were all within or very close to the range seen among normal speakers as reported in previous literature (see summary in [9], p. 584). However, the group difference for the shy /shy/ approached 3 dB, with the PD group having the smaller difference, on the lower edge of the normal range (Table 1). In a general sense, the smaller intensity contrast for a fricative-vowel combination in speakers with PD may be considered consistent with an overall loss of segment contrast in PD [6, 33]. In terms of speech motor control, the smaller intensity difference for the PD group is not easy to interpret, because it is not clear how the individual segments contributed to the group effect. One possibility is that the specific details of the intensity analysis introduced part of the difficulty in interpretation of the data. The intensities of the fricatives and vowels were averaged across the entire respective segments, meaning that effects at the onset and offset of the segments were included in the segment intensities. If, for example, speakers with PD produced more breathy voice at the onsets and offsets of vowels as compared to speakers in the HC group, this may have reduced the averaged vowel intensities in the PD group and therefore reduced their vowel-fricative intensity differences relative to speakers in the HC group. To follow up on this possibility, vowel-fricative intensity differences were recomputed for shy, with intensity measures derived from the middle 50 ms of the fricative noise and the initial 50 ms of the vowel (where the vowel intensity is likely to be most intense because of the proximity of F1 and F2 in the initial part of /∫/). This post-hoc analysis yielded a larger, average vowel-fricative difference for the healthy controls (9.76 dB), as compared to the patients with PD (8.02 dB), but the group difference was not as large as in the original analysis (Table 1). The post-hoc analysis, group difference was in the same direction (larger average vowel-fricative intensity difference in the HC group) as in the original analysis, but was not statistically significant. In the post-hoc analysis the PD vowel intensities were greater and the fricative intensities more or less the same as in the original analysis, supporting the idea that inclusion of weak vowel onsets and/ or offsets may have contributed to the significant difference of the original analysis. Further work is needed to clarify specific analysis strategies and segmental effects on vowel-consonant intensity differences in the repeated syllables task. It should also be noted that the moments analysis did not show PD fricatives to be consistently more dispersed (M2) or less peaky (M4) than the HC fricatives. Dramatic constriction effects between the groups that might affect relative fricative intensities across groups would be expected to be associated with these spectral differences. The absence of such differences points to the vowels as the primary contributors to the vowel-fricative intensity differences observed here.
Finally, spectral moments did not reveal a systematic pattern of significant difference between the speaker groups. As shown in the literature on healthy speakers, moments distinguished the two places of lingual articulation (/s/ and /∫/), with higher M1 and lower M2 and M3 for the word sigh as compared to shy, but in the present investigation the same general pattern was observed for speakers with PD.
The M1 difference between /s/ and /∫/, as a group, was not significantly different between the two speaker groups. This finding is consistent with another study which reported significant reduction in M1 difference measure for the stop pair /t-k/, but not in the fricative pair /s-∫/ [25]. In addition, the PD and HC groups demonstrated the same pattern for the M1 transition throughout the fricative. This finding is consistent with previous studies that coarticulation is relatively intact and shows normal patterns in individuals with dysarthria, although there has been a very limited number of acoustic and kinematic investigations and the results have been somewhat inconsistent [34–36]. However, the consonant selected for the current study may have been a factor. The lack of clear pattern of M1 transition, even in healthy controls, could be related to coarticulatory resistance that is more apparent for fricatives (e.g., [37,38]).
In summary, the primary findings of the study include (1) varying fricative-vowel temporal characteristics across groups, with similar fricative durations but much shorter vocalic durations for the PD group; (2) similar patterns of vowel consonant intensity differences for the two groups, with the results likely affected by the details of the intensity analysis; and (3) relatively preserved coarticulation of PD at least as reflected by the M1 transition across the fricative noise, approaching to the following vowel. Future research is in progress to investigate articulatory movement during the same fricative-vowel sequence. Overall, in the repeated-syllable task it appears the temporal analysis may be most fruitful for further exploration of the task as an index of speech motor control in dysarthria. Changes in the segmental nature of the task (e.g., semivowel-vowel syllables, syllables at different rates) may also be useful lines of inquiry in developing speech tasks that are simple yet sensitive to speech motor control deficits.
ACKNOWLEDGMENTS
Preliminary portions of the data were presented at the 2014 Annual Convention of American Speech Hearing Association in Orlando, Florida. This work was supported by grant NIH DC012405.