The Perceptions of Stereotypes of People Who Stutter in Hispanic University Students
Article information
Abstract
The purpose of this study was to obtain data regarding how stutterers are perceived in Hispanic populations in order to identify whether stereotypes exist across cultures. This investigation was completed in order to repeat and amplify previously completed research projects that have used the Bipolar Semantic Scale and have revealed correlations between the presence of stuttering and negative feelings and reactions. University students were surveyed utilizing the Bipolar Semantic Scale which provides information regarding how stutterers are perceived. When comparing the findings of this project that deals primarily with Hispanic population to the previous studies that were completed on non-Hispanic populations, it was revealed that negative perceptions regarding persons who stutter and persons who do not stutter persist across populations. Individuals surveyed decidedly viewed stutterers with lower overall personality characteristics and lower sociability characteristics.
INTRODUCTION
The Bipolar Semantic Scale by Wood and Williams [1] provides information regarding how persons who stutter (PWS) are perceived. The Bipolar Semantic Scale, at times referred to as the Bipolar Adjective Scale, was administered in this survey because it has been used previously to identify patterns in group stereotypes. It has proven to be a reliable test instrument and is easy to administer as per Snider and Osgood as cited by Wood and Williams [1]. The Bipolar Semantic Scales were created by including 25 selected traits used most frequently by speech language pathologists and pairing the terms with their antonyms which were chosen by graduate student and a dictionary listing [1]. This scale has only been completed in other non-Hispanic populations; therefore, those findings may not be appropriate for predominantly Hispanic communities. Stereotypes of stuttering has been extensively studied and previous findings from fluency scholars have revealed a general correlation between PWS and negative feelings and reactions [3–6].
This investigation is significant and provides information of import for the speech language pathology because it provides data specific for Hispanic populations. According to Shenker [2] from the Stuttering Foundation, 1 in 7 people in the U.S. speak another language other than English which translates to a total of 31.8 million PWS. Prevalence for stuttering is 1% of the population; therefore, Shenker approximates there are at least half a million bilingual people in the U.S. who stutter [2]. These numbers emphasize the importance of obtaining accurate information of the perceptions of PWS and identify whether differences exist between cultural groups. This is why this study was necessary because it provides an initial view of a specific group in the Hispanic population. A total of 146 Hispanic university students were surveyed which were 122 females and 24 males with a median age of 22.
Relevant literature
The results of this investigation identified two areas as salient in characteristics of PWS. These areas were Personality and Sociability. Relevant literature with diverse methodological components was found to identify whether additional scholars found patterns in the areas of Personality and Sociability.
Personality
According to the American Psychological Association, “personality refers to individual differences in characteristic patterns of thinking, feeling and behaving” [3]. The concept of personality having tri-components typically push individuals to be methodical in their point of view when coming into contact with diverse individuals [3]. However, research with PWS shows otherwise. Franck et al. [4] investigated the impact that different means of presenting stuttering (videotape presentation or hypothetical person) had on the participants. The results revealed that the participants showed a clear distinction between their perceptions towards stutterers as compared to non-stutterers directly reflecting the aspect of personality. Therefore, according to Franck et al. [4], school-age children hold similar negative perceptions of stutterers as adults do. Bricker-Katz et al. [5], investigated a group of older people who stutter to measure and identify their affective, cognitive, and behavioral responses towards stuttering and determine whether it might hinder the effectiveness of their communication. The study revealed PWS showed a significantly higher fear of negative evaluation, which is linked to social anxiety, inhibiting their personality. McGee et al. [6] conducted a study on the effects of a videotape documentary on high school students’ perceptions of a high school male who stutters. The purpose of the study was to investigate if the video would have a positive impact on individual’s perception of individuals who stutter. The results showed that the negative stereotype, which existed before the viewing of the videotape, remained after participants viewed the videotape [6]. Ozdemir et al. [7] compared attitudes toward stuttering with the use of the Public Opinion Survey of Human Attributes-Stuttering (POSHA-S). The results showed that the attitudes towards stuttering were very similar between all comparisons, except for the comparison between Eskisehir and an international database. The results revealed Eskisehir viewed stuttering more negatively when compared to attitudes around the world [7].
The aforementioned researchers identified negative stereotypes towards PWS through their investigations implementing various modes such as videos and surveys. The results remained persistent. PWS were viewed negatively even though personality includes more than an initial reaction to the individual but their thoughts, feelings and behavior as per the American Psychological Association.
Sociability
The Psychology Dictionary defines Sociability as “the need we have or the tendency to seek out companions, social relationships and friends” [8]. Current literature in stuttering emphasizes anxiety as a large factor in the area of sociability. Furnham and Davis [9] in their review of literature found that adults PWS had varying points of view when it came to anxiety and their social interactions. Some PWS self-identified their anxiety in such a way that they were identified as social phobics by the DSM-IV [9]. Other researchers found situational specificity in the levels of anxiety in PWS [9]. Research findings regarding sociability as an aspect of personality were in consensus in the following studies.
Doody et al. [10] investigated the stereotypes of stutterers and nonstutterers in three rural communities in Newfoundland. They explored what role exposure and familial relationship have on the perception of stutterers. The results showed that community members responded negatively to stutterers regardless of friendship or familial relation. The results from this study are corresponding to preceding studies, regardless of the difference in communities, in that the negative stereotype towards stutterers is adamant. The authors hypothesized that the negative stereotype came not from actual personality differences in stutterers but from behaviors such as physical tension and struggle which impacted their social interactions. Additionally, Bricker-Katz et al. [5], showed that, as is common in younger people who stutter, older individuals felt stuttering to be a negative experience during social interactions leading to limited communication.
Physical tension, struggle, and negative social interactions were the components that affected sociability in these aforementioned studies. Because sociability includes the tendency to seek out social relationships, it is apparent that presenting with physical tension, struggle and negative experiences may impact a PWS ability to forge forward in seeking social relationships as their ease to do so may be inhibited because of their fluency.
METHODS
A quantitative research method was utilized during this study. A survey that included the Bipolar Semantic Scale as the core component was administered. Participants were recruited from a public university in undergraduate and graduate courses in the communication sciences and disorders program who had taken courses in communication disorders, but not specifically fluency courses. These students were not PWS but had experiences with PWS. Subjects were also recruited via student invitation. Students who volunteered were asked to attend a survey meeting where they were asked to reflect upon their experiences with PWS and persons who do not stutter. Multiple survey group meetings opportunities were provided A copy of the informed consent and the survey were given to the students upon their arrival for their completion. The surveys were completed anonymously to reduce and minimize risk or discomfort. The completed surveys were placed in a slotted box at the exit of the classroom. There were approximately 146 participants who participated in this survey.
Exploratory factor analysis (EFA) was performed on the 25-item survey data from Bipolar Semantic Scale to identify the groups of correlated items. Table 1 provides the 21 items as well as variable names we assigned for the items. For categorical data, polychoric correlation is preferred than Pearson correlation in exploratory factor analysis [11,12]. However, due to the 13-point Likert-scale used by the survey items, the standard Pearson correlation produces very similar results as polychoric correlation does. We chose principle axis factor extraction method as the initial factor analysis revealed that there was a weak factor [12]. Because the survey was well-established and the factors were correlated, we chose to use the oblique rotation method, Geomin [13] to obtain clearer factor pattern. After EFA, summations of correlated items’ scores were calculated for later analysis. We utilized t test, ANOVA, ANCOVA, MANOVA and MANCOVA to study the source of variation among those scores. The analyses were conducted using R (version 3.2.2).

Factor analysis results with 21 items
Prior to initiating statistical analysis, data was analyzed through descriptive statistics which resulted in the exclusion of non-Hispanic participants and one participant with missing race information. Two items, perfectionistic and emotional, were found having very low communalities (lower than 0.2, indicating that these two items could not be predicted well from other items thus did not measure the same construct as other items) in the initial factor analyses. Thus, they were excluded from further analysis. We performed parallel analysis to determine the number of factors to retain and it suggested keeping two factors. At the final round of examine factor loadings, we found that aggressive and not-sensitive are cross-loaded on both factors therefore hard to interpret. They were then excluded from the analysis. In our analysis, the complete data from answers on 21 survey items by 146 Hispanic students were studied.
RESULTS
Two factors were extracted and they accounted for 63% of the variance in the sample. The factor loadings correlation coefficients between two factors are reported in Figure 1. Figure 2 also plots the factors loadings in two-dimension, which indicated clearly the separation of the items belonging to two factors. The two factors were named personality (Trait 1) and sociability (Trait 2). The reliabilities (Cronbach’s Alpha) were 0.96 for all twenty items, 0.95 for fifteen items in personality group and 0.83 for the five items in sociability group.
Factor plot of semantic components.
Factor plot of semantic components.
The items loaded on the personality factor were open-guarded, calm-nervous, bold-shy, self-assured-self-conscious, relaxed-tense, composed-anxious, outgoing-withdrawn, loud-quite, talkative-reticent, approaching-avoiding, fearless-fearful, confident-afraid, extroverted-introverted, daring-insecure, and bragging-self-derogatory. This was the stronger factor and accounted for 49% of total variance among all items. In further analysis, we use the mean of such fifteen adjective pair ratings as a response variable. The items loaded on the sociability factor were cooperative-uncooperative, friendly-unfriendly, pleasant-unpleasant, intelligent-dull, and flexible-inflexible. This factor accounted for 14% of total variance among all items. In further analysis, we use the summation of such five adjective pair ratings as a response variable. In both personality and sociability factors, a higher score indicates a person’s better perception of the speaker’s personality or sociability. Because of the paired nature of the survey design, the difference between the two summations of ratings on non-stutterers and stutterers was treated as the dependent variable in further analysis.
Table 2 reports both descriptive statistics and univariate analyses results on personality and sociability scores. Students reported significant higher overall personality score for non-stutterer (with the average difference of 52.19 and large effect size, Cohen’s d=1.45). Both male and female students reported significant average difference between non-stutterer and stutterer on their perceptions of overall personality of the speakers. However, there was no significant gender effect and the effect size for gender is medium (Cohen’s d=0.38). When age was taken into account as covariate in ANCOVA, it also yielded non-significant results for gender effect with medium effect size (modified Cohen’s d=0.37).
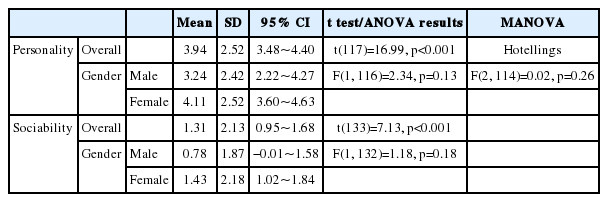
Descriptive statistics and univariate analysis
Meanwhile, students reported significant higher overall sociability score for non-stutterers (with the average difference of 6.84 and large effect size, Cohen’s d=0.59). Both male and female students reported significant average difference between non-stutterers and stutterers on their perceptions of overall sociability of the speakers. However, gender effect was revealed to be non-significant with small effect size (Cohen’s d=0.2). When age was taken into account as covariate in ANCOVA, it also yielded non-significant results for gender effect with small effect size (modified Cohen’s d=0.2). Figure 1 contains boxplots for female and male students’ perception differences between stutterer vs non-stutterer on personality and sociability, respectively.
Figure 2 depicts the pattern of male and female students’ perception on non-stutterer versus stutterer in term of two traits, personality and sociability. The MANOVA results revealed that there was no significant gender effect (Hotelling-Lawley F(2, 116)=1.4, p=0.25) on rating non-stutterers versus stutterers in term of personality and sociability, with medium effect size (η2=0.02) as per the suggested verbal labels for Cohen’s d regarding effect size which indicates medium effect for η2 for a d of 0.3 at an r of .148 and an η2 of 0.022 [13,16]. When age was taking into account as covariate, the MANCOVA results stayed non-significant with medium effect size (η2=0.03) on gender.
DISCUSSION
Williams and Diaz [14] stated it best when describing the stereotypes of PWS by stating individuals classify and create categories of schemas in order to organize complicated surroundings. They continued on this same frame of thought by stating stereotypes places people in categories that they do not necessarily adhere to. Williams and Diaz [14] arrived at a reasonable explanation as to why stereotypes occur with PWS, some of which are beginning to be disproven by current research. Some of the reasons for the existence towards PWS include the following: the impact anxiety has on the attitudes of PWS when speaking as compared to PWDS; the concept of self-fulfilling prophecy where PWS are induced to present themselves in a way that others expect them to; media representation of PWS influencing the perceptions of both PWDS and the actual PWS; and self-esteem and the connection between how the PWS feels about themselves and how they feel about the group of people within their surroundings [14].
Doody et al. [10] found that negative stereotypes towards stutterers that exist in mainstream populations were consistently found in small rural populations as well. By the same token, results from this investigation in Hispanic populations indicate that negative stereotypes towards stutterers persist. Additionally, it is interesting to note that participants in the Doody et al. [10] survey had a familial relationship with a stutterer or they stated that they knew a stutterer. Even though this was the case, the negative stereotypes were found. Both studies indicate the presence of negative stereotypes towards stutterers. When gender was taken into consideration, as was the case in this investigation, it was clearly found that males perceived stutterers with less negativity when compared to females. This brings to light another research question. Do women differ greatly in the manner in which they perceive individuals who stutter when compared to men? St. Louis [15] identified public attitudes towards PWS were similar between males and females. In St. Louis’s review of literature, it was iterated that a difference between male and female perceptions was non-existent whether the studies were completed using hypothetical or actual PWS [15]. This is a possible avenue for further study. Future research may include a larger sample of both female and male participants with a balanced sample of different age groups as this investigation included a younger sample.
When comparing the findings of this project that deals primarily with Hispanic individuals to the previous studies that were completed on non-Hispanic groups, it was revealed that negative perceptions regarding stutterers versus non-stutterers persist across various cultural groups. In this sample of Hispanic individuals, the perceptions obtained paralleled those of other studies [3–6]. Individuals surveyed decidedly viewed stutterers with lower personality characteristics and lower sociability characteristics. Ultimately, the persistent negative perception of stutterers remains and is prevalent throughout various cultures. As a member of the speech-language pathology profession, we view this as an area of continuous concern. It is imperative to educate the general population regarding the stuttering population to alleviate the negative perception that is directed towards the stutterers.
Possible avenues for increasing awareness include the promotion of support groups within the community for the families and acquaintances of PWS and ultimately to the general public. Public service announcements through media are also additional avenues of increasing awareness of the nature of stuttering. Organizations such as the Stuttering Foundation and the National Stuttering Association provide, free of charge, multiple sources of information about the nature of stuttering. These are simple changes that can influence the perceptions of the general public and positively impact the lives of PWS.
Notes
The author has no conflict of interests.